.svg "Gorilla ROI")

Article Summary
✅ Amazon seller dashboard in Google Sheets works best when raw data tabs are protected, calculation tabs handle formulas, and review views stay clean enough for weekly decisions.
✅ The four views I would build first are SKU sales, margin, inventory coverage, and weekly ops summary
✅ The dashboard should not share space with raw imports. Keep source tabs protected, formulas in calculation tabs, and human-facing views in dashboard tabs.
Amazon dashboard is easier once the data is already live
An Amazon seller dashboard sounds like the hard part until you have tried to keep one updated by hand.
I have built enough of these sheets for my own Amazon business to know where they break. The chart and formula are usually fixable, but the report fails when the source data depends on someone downloading orders, inventory, ad spend, fees, and refunds before the dashboard can be trusted.
That is why this article assumes the Amazon data is already loading in Google Sheets.
If your raw data is not automatically connected yet, start with the Amazon seller data to Google Sheets guide page first. This page is about what I would build after the raw data is already there.
Once the data layer is live, the dashboard has one job. To help you make the next decision without opening five Seller Central screens.
The dashboard breaks when raw data and formulas share the same tab
A dashboard should never sit on the same tab as the raw data it depends on.
That is where Google Sheets dashboards get fragile. The source data refreshes, rows move, formulas point at the wrong range, and someone stops trusting the file.
So before you build a chart, set the structure:
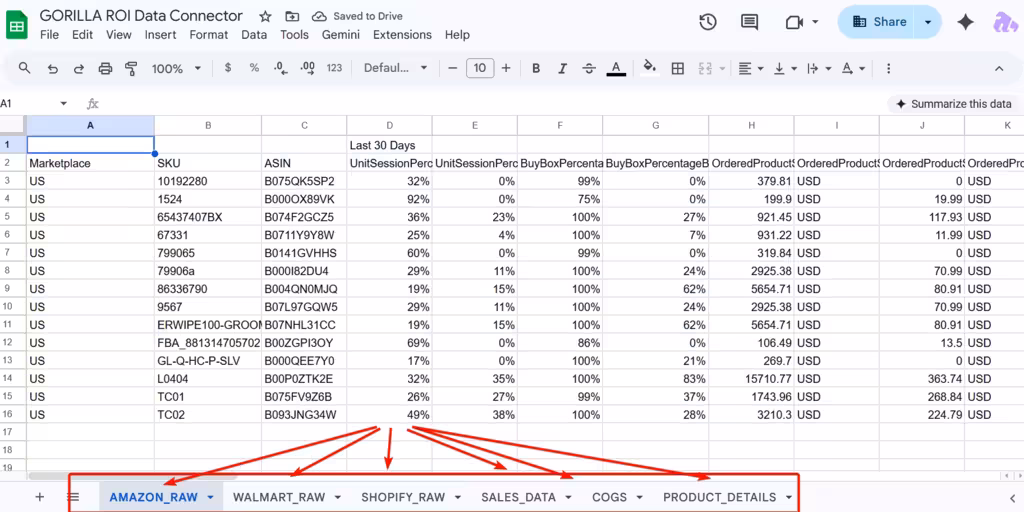
- SALES_DATA: raw Amazon sales rows. No formulas. No manual edits.
- PRODUCT_DETAILS: one row per SKU with SKU, ASIN, FNSKU, title, brand, marketplace, and grouping fields.
- COGS: cost of goods by SKU, updated when your landed costs change.
- INVENTORY_RAW: available, reserved, inbound, and days-of-supply fields.
- SETTLEMENT_RAW: settlement, fee, refund, and payout data.
- DASHBOARD: the human-facing tab your team opens.
Google’s help docs show how to protect sheets and ranges inside Google Sheets. Use that on every raw tab before the workbook gets shared. Google Sheets protected ranges explains the sheet protection workflow.
Simple rules: protect source tabs, write formulas somewhere else, and let the dashboard read from those formulas. These tabs in the google sheet show how to load and separate the data so it's not all mixed up everywhere. That way, the next part of actually building a dashboard becomes so much easier.
Build these four dashboard tabs first
The first dashboard should answer weekly business questions, not impress someone with visuals.
I would build four tabs before adding anything else:
Start with SKU_DAILY because it proves your sales data is landing correctly. Build MARGIN_SUMMARY last because it needs settlement data and COGS to be clean first.
SKU_DAILY shows what moved
SKU_DAILY should show units and revenue by SKU across short lookback windows.
This is the tab I would open first on Monday morning. Not because it answers everything, but because it tells me where to look.
Use a QUERY formula to group sales by SKU over a date range. Google says the QUERY function runs a Google Visualization API Query Language query across data, which makes it useful for filtering and grouping rows in one formula. Google Sheets QUERY function explains the syntax.
Example 7-day units formula:
=QUERY(SALES_DATA!A:Z,
"SELECT B, SUM(E)
WHERE A >= date '"&TEXT(TODAY()-7,"yyyy-mm-dd")&"'
GROUP BY B
LABEL SUM(E) 'Units 7d'",1)
In this example:
- Column A is the order date.
- Column B is the seller SKU.
- Column E is units ordered.
- The output is one row per SKU with units sold in the last seven days.
Then add 14-day and 30-day versions next to it. Your team can see short-term movement and a longer trend without changing date filters inside Seller Central.
WEEKLY_REVIEW keeps the meeting from becoming a data hunt
WEEKLY_REVIEW should compare this week, last week, and the 4-week average.
I would keep this tab tightly focused with the following headers:
- Revenue this week
- Revenue last week
- Revenue 4-week average
- Units this week
- Units last week
- Units 4-week average
- Top SKU increases
- Top SKU drops
- Notes or owner
For simple weekly totals, SUMIF is enough. Google says SUMIF performs conditional sums with a single criterion, which works well for period totals and SKU-level totals. Google Sheets SUMIF explains the function.
Example revenue formula for the last seven days:
=SUMIF(SALES_DATA!A:A, ">="&(TODAY()-7), SALES_DATA!F:F)
In this example:
- Column A is the order date.
- Column F is revenue.
- The formula sums revenue where the order date is within the last seven days.
For last week, subtract the current 7-day total from a 14-day total:
=SUMIF(SALES_DATA!A:A, ">="&(TODAY()-14), SALES_DATA!F:F)
- SUMIF(SALES_DATA!A:A, ">="&(TODAY()-7), SALES_DATA!F:F)
That gives your team a clean weekly comparison without someone pulling separate Seller Central date ranges during the meeting.
REORDER_SIGNALS should flag risk
REORDER_SIGNALS should show which SKUs need attention before the inventory goes out of stock.
This tab should not become a full inventory planning model. It only needs to flag the next risk.
Use:
- SKU
- ASIN
- Product title
- Available units
- Reserved units
- Inbound units
- 30-day units sold
- Days of supply
- Reorder flag
- Owner or note
If your inventory tab already has days of supply, pull it into the dashboard by SKU. If not, calculate it from available units and average daily sales.
Simple days-of-supply formula:
=IFERROR(Available_Units / Average_Daily_Units, "")
Simple reorder flag:
=IF(D2<30, "Reorder", "OK")
In this example, D2 holds days of supply. Change 30 to match your supplier lead time.
This is the difference between a dashboard and a report. A report says you have 112 units. A dashboard says you have 112 units and 12 days before the decision gets painful.
For deeper inventory logic, use the FBA inventory data in Google Sheets guide.
MARGIN_SUMMARY is built last
MARGIN_SUMMARY should be built only after settlement data and COGS are clean enough to trust.
This is where a dashboard can hurt you if you rush it. Revenue is easy to show. Margin requires the right revenue, the right fees, the right refunds, and the right COGS.
Use VLOOKUP to bring product costs into the margin tab by SKU. Google says VLOOKUP searches for related information by row and returns a matching value from another column. Google Sheets VLOOKUP explains the function.
Example COGS lookup:
=VLOOKUP(A2, COGS!A:D, 4, FALSE)
In this example:
- A2 is the SKU in MARGIN_SUMMARY.
- COGS!A:D is the COGS table.
- Column 4 returns cost per unit.
- FALSE forces an exact match.
Then calculate gross margin:
=Net_Settlement_Revenue - (Units_Sold * COGS_Per_Unit)
For SKU-level settlement revenue, use a SUMIF against settlement data:
=SUMIF(SETTLEMENT_RAW!C:C, A2, SETTLEMENT_RAW!G:G)
In this example:
- Column C in SETTLEMENT_RAW is SKU.
- Column G is settlement revenue.
- A2 is the SKU under review.
Do not fake this tab. If SETTLEMENT_RAW is not clean or your COGS table is not current, label the tab incomplete and keep it out of the weekly meeting.
For fee source data, use the Amazon seller fees into Google Sheets guide.
The dashboard formulas need guardrails

Your dashboard should make spreadsheet failure obvious before someone acts on bad numbers.
Add these checks before sharing it:
- Last refreshed timestamp
Put a timestamp at the top of the dashboard so the team knows whether the data is from this morning or last week. - Blank SKU check
Flag rows in raw data where SKU is blank. - Date format check
QUERY breaks when date columns are stored as text. Check date formatting before blaming the formula. - Missing COGS check
Flag any SKU in MARGIN_SUMMARY where VLOOKUP returns blank. - Negative margin check
Highlight SKUs where margin drops below your threshold. - Source row count
Show the row count from SALES_DATA and compare it to the last refresh.
Here is a simple missing COGS flag:
=IF(ISBLANK(VLOOKUP(A2, COGS!A:D, 4, FALSE)), "Missing COGS", "OK")
And here is a basic row count check:
=COUNTA(SALES_DATA!A:A)
I do not care how polished the dashboard looks if it cannot tell you when the source data is stale or incomplete.
Charts help, but tables carry the decision
Use charts when they make movement obvious. Use tables when someone has to act.
Good chart uses:
- Sales trend over time
- Units ordered over time
- Spend vs sales
- Return rate trend
- Stock risk by product group
Good table uses:
- SKU movement
- Reorder flags
- Margin watch
- Missing COGS
- Return issues
- Products assigned to an owner
A wall of charts looks good in a screenshot. It is slow in a meeting.
Google Sheets supports slicers that filter charts and pivot tables, which can help your team change the view by date range, marketplace, brand, or product group without touching the raw data. Google Sheets slicers explains how slicers work.
But do not use slicers to cover up weak structure. If the tabs underneath are messy, a slicer only makes the mess interactive.
Where Gorilla ROI fits in building spreadsheets
Gorilla ROI fits underneath the dashboard by keeping source tabs current.
Gorilla ROI is a Google Sheets data hub for ecommerce operations. Amazon, Ads, Walmart, Shopify, Meta ads and more.
In this workflow, the connection is already live. Amazon sales, orders, inventory, advertising, fees, returns, and product data are landing in Google Sheets. The dashboard sits on top of that connected data.
The order is:
- Gorilla ROI refreshes the source tabs.
- Calculation tabs clean and join the data.
- Dashboard tabs show the team-facing views.
- Your team decides what needs attention.
Since we automate the data retrieval and feed live data to your sheets, we make it easier to keep the data current so your dashboard is not built on stale CSVs or requiring someone overseas to update it for you.
For the sales tracker function that feeds the dashboard, use the Amazon sales tracker in Google Sheets guide. For ad-side fields like ACoS, ROAS, TACoS, clicks, and impressions, use the Amazon advertising metrics article.
Watch How I Create Reports on the Fly
Gorilla ROI is not a dashboard product
If you want to log in and see a finished dashboard with every chart already designed, that's not us.
Use a dashboard product if you want preset visuals and less spreadsheet work. Use Seller Central if one-time reports are enough. Use Gorilla ROI if you already use Google Sheets and don't want to change your workflow, but want to speed it up and automate it.
Dashboard build checklist
Check this before you share a dashboard with the team. Especially if you are planning to submit it a manager or boss.
- Protect every raw tab before building charts.
- Keep formulas out of raw data tabs.
- Build calculation tabs before dashboard tabs.
- Use SKU, ASIN, marketplace, and date as the main join keys.
- Create one executive dashboard tab and no more than four deep-dive tabs at first.
- Add slicers for date range, marketplace, brand, and product group.
- Label every chart with the exact source tab or calculation it uses.
- Add a last refreshed timestamp.
- Add missing COGS and blank SKU checks.
- Assign one person to check refresh status before the weekly meeting.
If the dashboard does not change the meeting, it is decoration.
Amazon seller dashboard FAQ
What should an Amazon seller dashboard include?
An Amazon seller dashboard should include SKU movement, weekly sales trend, reorder signals, margin summary, ad context, returns, and cash or payout signals. Start with the views your team checks weekly.
Can I build an Amazon seller dashboard in Google Sheets?
Yes, if Amazon data already lands in structured tabs. Google Sheets can handle dashboard views with formulas, tables, charts, pivot tables, and slicers, but the source tabs need to stay protected.
Should the dashboard use raw data tabs directly?
No. Use raw tabs as the source, calculation tabs for joins and formulas, and dashboard tabs for team-facing views. Direct charts on raw imports become fragile when rows move or source columns change.
What formulas are useful for an Amazon dashboard in Google Sheets?
Start with QUERY for filtered SKU sales views, SUMIF for period totals or SKU totals, and VLOOKUP for pulling COGS or product details into margin tabs.
What is the first dashboard tab I should build?
Start with SKU_DAILY. It proves the sales data is landing correctly and shows which SKUs moved over 7, 14, and 30 days. Build margin views later after COGS and settlement data are clean.
Does Gorilla ROI build the dashboard for me?
Gorilla ROI keeps Amazon data current in Google Sheets. Your team still builds the dashboard tabs, formulas, slicers, and analysis views. That is the point: the sheet matches how your team runs the business.
When should I use a dashboard product instead?
Use a dashboard product when you want preset charts and do not want spreadsheet setup. Use Google Sheets when your team needs custom formulas, SKU logic, and control over how sales, inventory, margin, ads, and returns are joined.