.svg "Gorilla ROI")

Article Summary
🟤 A free Amazon sales spreadsheet should show daily sales, SKU movement, and inventory pressure in one Google Sheets file.
🟤 The spreadsheet works best when account totals, product rows, and daily history are separated instead of mixed into one fragile tab.
🟤 Manual updates are fine at first, but connected Amazon data is the better choice once the sheet affects reorder, pricing, and ad decisions.
A free Amazon sales spreadsheet can show the right number and still cost you $900.
In 2016 we had one SKU moving faster than anything else in the catalog. The sheet showed 22 days of stock. I placed no reorder. Three days later I was looking at 8 units left in FBA and a supplier with a 14-day lead time.
The sheet was not broken. The export was 4 days old and I had not noticed. I made a real reorder decision on a number that was already wrong when I read it.
We have run our own Amazon catalog since 2012. The snapshot discipline came directly from that incident. A sheet that shows the right columns is not useful if the numbers in those columns are 4 days behind the business.
That reorder cost $900 more than it should have. The sheet showed 22 days. I had 8.
Manual Sales Sheets Fail When the Update Becomes the Work
A free Amazon sales spreadsheet starts breaking down when the update process becomes heavier than the sales review.
I still like spreadsheets. I just do not like pretending that manual spreadsheet work is free.
If you are the only person touching the file, you can get away with a lot. You know which tab is fragile. You know which formula should never be touched. You know which export needs cleanup before it gets pasted.
The problem starts when the file becomes part of the business. A VA updates it. A manager reads it. You check it before a reorder. Someone else wants to know why the numbers do not match Seller Central.
That is when a free spreadsheet needs a cleaner structure.
Your Sales Snapshot Should Match Your Morning Check
A useful Amazon sales spreadsheet should match the way you actually check the account, not the way a template designer imagined you would work.
When I open a sales sheet, I do not want to hunt through tabs. I want to know whether sales moved, which SKUs caused the movement, and whether anything needs attention today. That does not require a complicated file. It requires the right numbers in the right order.
For the full step-by-step on building the tracker, pulling SKU-level sales data by period, and feeding a dashboard, see How to Create an Amazon Sales Tracker with Google Sheets.
Build the Sheet Around the Decision You Keep Avoiding
A sales spreadsheet should make the uncomfortable decision easier to see.
For me, that decision was usually inventory. I did not want to find out late that a SKU was selling faster than expected. I also did not want to slow down ads on a product that still had enough stock. The spreadsheet had to show units ordered, available inventory, and days of supply close together, or I would keep bouncing between reports.
Your decision might be different. If pricing is the issue, put Buy Box share and sales movement close together. If ads are the issue, put ad spend near SKU sales so you can see whether paid traffic is helping the products you care about. If product performance is the issue, put sessions, conversion rate, and units ordered in the same product view.
That is the part I care about more than the design. The sheet should reduce the distance between the number and the decision.
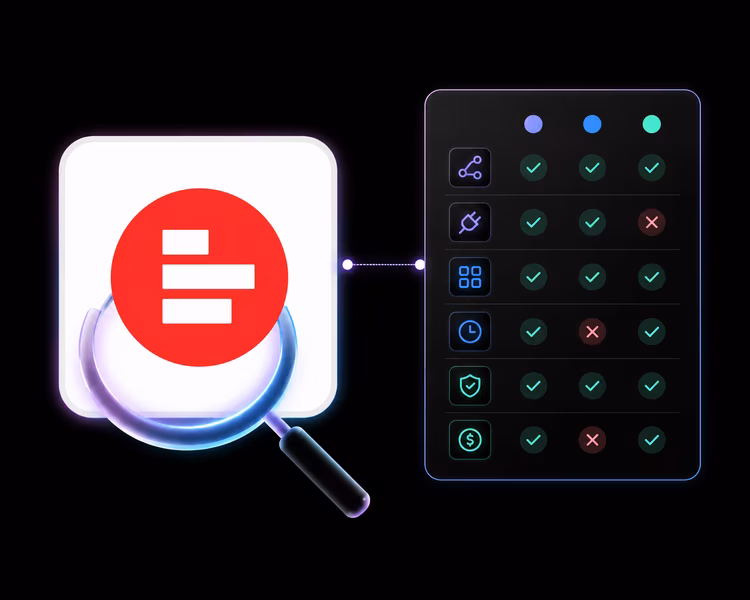
Gorilla ROI was built from that frustration. It pulls Amazon data into Google Sheets so you can work in the file you already use instead of downloading the same reports every morning. In our own reporting workflow, large pulls such as 20,000 rows can finish in under 30 seconds, depending on report type, account size, Google Sheets load, and the specific data pull.
If your sheet is still built around downloaded files, the next step is building around Amazon Seller Central data in Google Sheets so the spreadsheet starts with cleaner data instead of manual cleanup.
Sales Snapshot Columns to Include
A free Amazon sales spreadsheet should use specific column names that connect directly to sales, inventory, and product decisions.
Amazon’s Reports API can retrieve and manage reports for selling activity, including inventory, orders, fulfillment, tax information, returns, and related selling data. That is why I would rather build the spreadsheet around structured report data than screenshots, copied totals, or manually cleaned exports. Check the Amazon Reports API documentation.
For order-level review, connect the sales snapshot to an Amazon order export to spreadsheet workflow so you can move from account totals to order detail when needed.
For a full breakdown of manual vs connected vs third-party tool options, see Amazon Sales Analytics and Reporting Tools.
Free Amazon Sales Snapshot Spreadsheet
You can download the free sales spreadsheet template and more from our resources page.
Key Terms
FAQ
What should a free Amazon sales spreadsheet include?
A free Amazon sales spreadsheet should include date, seller SKU, ASIN, product title, units ordered, ordered product sales, sessions, conversion rate, Buy Box share, available inventory, and days of supply. Those fields show sales movement and product risk in one file.
Can Google Sheets track Amazon sales?
Google Sheets can track Amazon sales when the data is organized by date and SKU. I would keep the first version focused on account totals, product movement, and raw history before adding extra tabs.
What is the difference between a sales spreadsheet and a sales report?
A sales report is the raw Amazon data pulled from Seller Central or Amazon’s API. A sales spreadsheet organizes that data into a working file you can use for reorder, pricing, and product review.
Can a free Amazon sales spreadsheet support inventory planning?
A free Amazon sales spreadsheet can support inventory planning when the sheet includes units ordered, available inventory, and days of supply. For deeper planning, connect the sales snapshot to an Amazon inventory forecasting workflow.
Should advertising data go inside the sales spreadsheet?
Advertising data belongs in the sales spreadsheet when ad spend changes product-level sales decisions. I would keep the first version focused on sales and SKU movement, then add ad spend beside the SKUs where paid traffic affects reorder or margin decisions.
Is a free spreadsheet enough for a larger Amazon catalog?
A free spreadsheet can work for a larger catalog if the data structure is clean and the update process is reliable. The file size is not the main issue. The real question is whether you can trust the numbers before making a decision.
Forwardable Checklist
Send this checklist to the person responsible for the Amazon sales review.
A sales spreadsheet passes the test when you can open the file and make the next decision without cleaning data first.
Final Takeaway
A free Amazon sales spreadsheet is worth using when it gives you a clean daily view of sales, SKU movement, and inventory pressure.
I would start with the simplest useful version. Keep account totals, product rows, and daily history separate. Once the update process starts slowing the review, connect the sheet to Amazon data and remove the repeated export work.