.svg "Gorilla ROI")

Article Summary
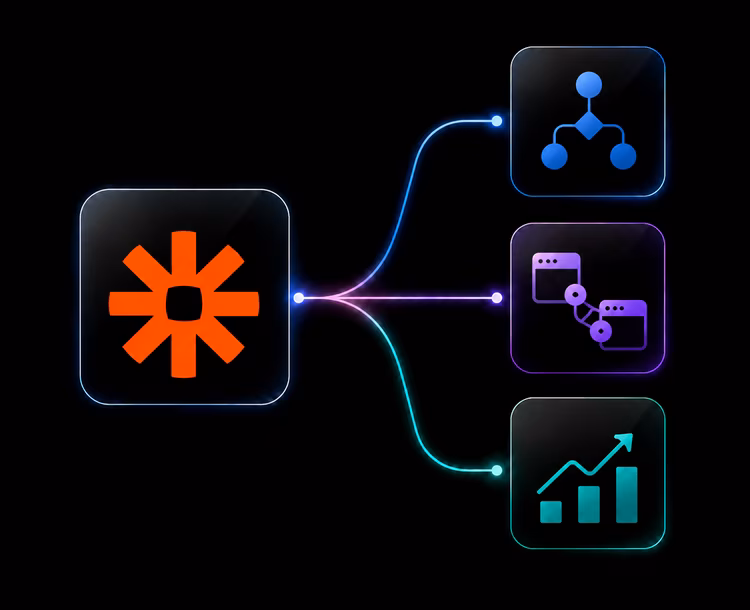
✅ Gorilla ROI is a point-and-click Google Sheets data connector that loads Amazon, Shopify, Walmart, and Amazon Ads data into structured spreadsheet tabs.
✅ The product workflow is simple: connect the source, choose the data area, select fields, load the rows into Google Sheets, then build review tabs your team checks each week.
✅ Gorilla ROI fits when your team already works in Sheets. If you want a finished dashboard with no spreadsheet setup, use a dashboard product instead.
Gorilla ROI reviews rave about time saved
We hear things like this all the time.
“Great product that integrates with Google Sheets. I can get all the data that I need to put together reports and information that I need. Easy to use and I love it.” - Steven Lam
"If you use spreadsheets a lot, sell on Amazon, and value your time – GorillaROI is a no-brainer. We use this every day in one way or another." - John Derringer
“Gorilla ROI interfaces easily with Google Sheets and serves as a great tool for growing Amazon Sellers to reduce reporting friction.” - Baxter Home Selections
The pattern in our customer reviews is consistent. Nobody writes about a feature they discovered because they write about hours they stopped losing.
That is why public seller conversations and complaints matter more than feature lists. One Amazon seller asked for daily automation that exports “sku, qty sold, fees paid, and sale price” into Google Sheets so they could compare sales against ad spend in a single source of truth.
Another Amazon seller on Reddit said their assistant gathered SellerBoard, Seller Central, and Advertising data into one spreadsheet three times per week, then asked for a way to automate the gathering because Excel was still the preferred work surface.
This the problem Gorilla ROI was built to solve: your Amazon data already exists, but getting it into a usable sheet on a schedule, without anyone touching it, is where your time disappears.
There’s a reason why Cory from Woodies.com said,
“Data automation at its finest. I run a 2 million dollar business with 2 employees. Tools like Gorilla allow me to do it.”
That is the product in plain English. Gorilla ROI exists because ecommerce data already lives in Amazon, Shopify, Walmart, and ad accounts, but someone still has to get it into the spreadsheet.
Why Gorilla ROI "just works"
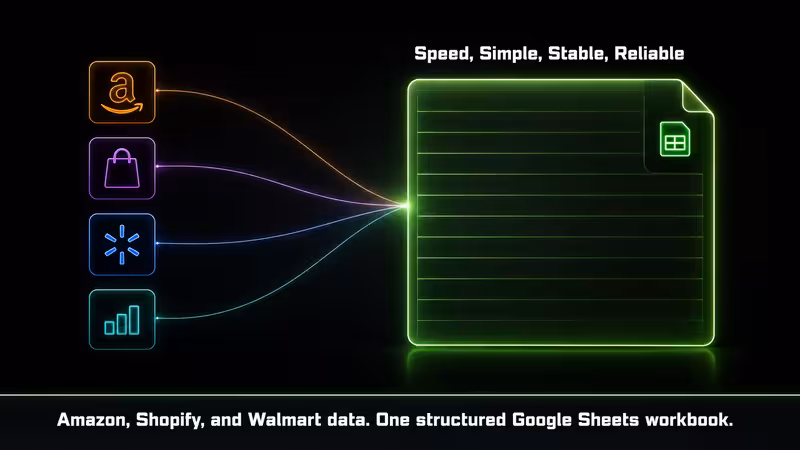
Gorilla ROI connects ecommerce accounts to Google Sheets so the sheet can hold current source data instead of stale exports.
You install our point and click add-on, connect your account, choose the data you want, and load rows of data into your existing or new spreadsheet.
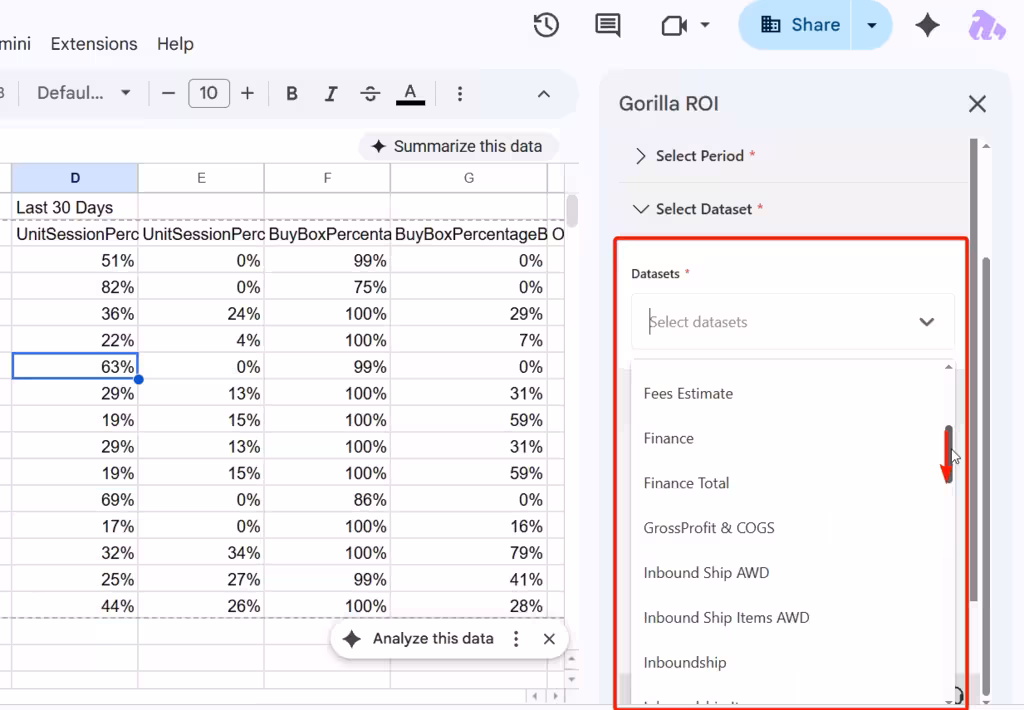
Our Google Workspace Marketplace listing also explains how you can use our data connector for Amazon Seller Central, Amazon Advertising, Shopify, and Walmart Seller Center. A simple point-and-click sidebar for choosing a metric, date range, and query.
We have an advanced feature for spreadsheet nerds like us, but only if you want it.
I would think of it like changing your sheet from a filing cabinet into a feed.
A filing cabinet only contains what someone put there. Our data feed keeps bringing the new rows in. Your team still decides what to build on top, but the source tab does not depend on a person remembering to download the file.
Easy data loading from the first time
Your first Gorilla ROI setup should be simple enough that you can tell whether the connection worked.
I would not start with a full profit loss template. Start simple.
Start with something your team already updates by hand.
Pick one:
- Amazon sales
- Amazon inventory
- Amazon orders
- Amazon Ads
- Shopify orders
- Walmart orders
Send that data into one raw tab. Name it something boring, like AMAZON_SALES_RAW or INVENTORY_RAW.
Then leave that tab alone.
Do not type notes into it. Do not add formulas to it. Do not let your team paste over it.
Same reason you do not write grocery notes on your bank statement. The source record should stay clean, and your working notes belong somewhere else.
Google Sheets lets you protect sheets and ranges so teammates can view cells without editing them. I would protect raw tabs before sharing the workbook.
It's just a one time process to set things up like in this video where I show you how it's done for product data.
See how easy it is to connect
See how quick and easy it is to connect your account and start syncing.
Gorilla ROI starts by connecting your ecom accounts to our system. Connect your Amazon account, give it API access and then we start syncing your historical data.
- Install the add-on in Google Sheets.
- Connect your ecommerce accounts and wait for us to sync your data.
- Choose the data group.
- Pick the report or fields.
- Choose the date range.
- Send the data to a tab.
- Build the review tab your team checks.
We have detailed documentation to help you with the data connector to get live data from Amazon Seller Central, Amazon Ads Data, Shopify Reports, and Walmart Data.
Reports your team actually needs
Gorilla ROI is useful when the fields landing in the sheet match the way your team makes decisions.
For Amazon sales, the supported data page lists fields like Marketplace, SKU, ASIN, OrderedProductSales, UnitsOrdered, and TotalOrderItems.
For inventory, it lists fields like Fulfillable, Unsellable, Reserved, Inbound_Working, Inbound_Shipped, and Inbound_Receiving.
For Amazon Ads, it lists fields like Campaign Name, Spend, Sales, Orders, ROAS, ACOS, Clicks, CTR, Impressions, and CPC.
Check out the number of different datasets you can pull. We offer the deepest set of data reports than any competitor.
If you know your business use case, it's easy to get the data you need. Here are some scenarios we see from our users and how organize it for easy viewing.
You can apply simple concepts like this table to get started quickly and easily.
Start with the report your team already updates by hand. If that tab saves time and survives refresh, add the next one.
The spreadsheet work does not disappear
Gorilla ROI gets the data into Sheets. It does not decide how your business should read the data.
That is the trade-off.
If you want a finished screen with every chart already built, Gorilla ROI is the wrong category. A dashboard product will feel faster.
If you want your own spreadsheet logic, Gorilla ROI makes more sense. You can build around your SKU naming, COGS, supplier groupings, marketplace split, margin rules, and weekly review style.
This is why user reviews matter more than a feature list.
Casey, a COO of an 8 figure brand said they had used Gorilla ROI for 3 years to manage an Amazon agency with over 10 accounts, and that pulling data directly into Google Sheets made analysis and planning easier.
That review also mentioned the learning curve, which is fair. Once the data is in Sheets, your team still needs to know what it wants from the workbook.
That is not a weakness if your team already uses Google Sheets. It is the point.
Formulas are the advanced layer
Gorilla ROI still supports formulas features for advanced spreadsheet folks.
The point-and-click connector is the easier path for most teams. You load full datasets into raw tabs, protect those tabs, and build review views on top.
The formula layer is useful when you need tighter control.
For example, an advanced user may want one exact sales value, inventory number, fee total, or profit result returned into a specific cell. Gorilla ROI’s formula-based reporting page shows this advanced workflow for users who want flexible Amazon data imports inside Sheets.
But start with point-and-click pulls first. Easy and quick win.
Add formulas later when the sheet needs exact cell-level control.
That keeps the setup easier for a manager, VA, or finance person who just needs the data in the workbook before the meeting starts.
A real first workflow: inventory review
Inventory is a good first Gorilla ROI workflow because everyone uses it.
If inventory is stale, then your reorder decision is stale.
I would set it up like this:
- Pull Amazon inventory into INVENTORY_RAW.
- Pull Amazon sales into SALES_RAW.
- Keep both raw tabs protected.
- Build STOCK_REVIEW from those two tabs.
- Add columns for available stock, reserved stock, inbound stock, 30-day units sold, and days of supply.
- Add a reorder flag.
- Put buyer notes in TEAM_NOTES, not inside the raw tab.
You are trying to answer one question:
Can this SKU keep selling?
That question needs more than one field. Fulfillable tells you what is currently sellable. Reserved tells you what is tied up. Inbound_Working, Inbound_Shipped, and Inbound_Receiving tell you what is coming but not fully available yet.
This is where a connected sheet becomes useful. You stop checking a static inventory export and start building the review your team uses each week.
For a deeper inventory data walkthrough, use the FBA inventory data in Google Sheets guide.
Shopify, Walmart, and Ads belong in separate source tabs
Gorilla ROI supports a broader ecommerce workbook when your team runs more than Amazon.
The same point-and-click connector collection includes Shopify Reports and Walmart Data. We continue to expand our integrations for platforms important for ecom sellers.
I would still keep each source separate at first.
Use tabs like:
- AMAZON_SALES_RAW
- AMAZON_ADS_RAW
- SHOPIFY_ORDERS_RAW
- WALMART_ORDERS_RAW
- SKU_MAP
- CHANNEL_REVIEW
Amazon, Shopify, and Walmart do not speak the same reporting language. Your sheet is where those rows get mapped into one product view.
For the combined channel setup, use the Amazon Shopify Walmart reporting guide. For Amazon ad metrics like ACoS, ROAS, TACoS, CTR, CPC, and impressions, use the Amazon advertising metrics article.
The best setup has raw tabs, review tabs, and decision tabs
A Gorilla ROI workbook works best when each tab has one job.
I would split the file into three groups:
- Raw tabs receive data from Gorilla ROI.
- Review tabs turn those rows into weekly views.
- Decision tabs hold human notes, owners, dates, and follow-ups.
If your buyer leaves reorder notes inside an imported inventory row, the next refresh can separate the note from the row it was meant to explain.
Here is the safer version:
- Raw data lands in INVENTORY_RAW.
- The team reviews stock risk in STOCK_REVIEW.
- The buyer writes next steps in REORDER_ACTIONS.
The data says what happened and the decision tab says what your team is doing next.
True cost comparison to think about
Gorilla ROI is the wrong choice if the manual process is still cheaper and safer.
Add the hours your team spends each week downloading reports, cleaning CSV files, fixing formulas, checking tabs, and rebuilding views. Multiply those hours by the real hourly cost of the person doing the work.
If that number is lower than the subscription and the sheet is not driving important decisions, keep the manual process for now.
I would also skip Gorilla ROI if your team does not use Google Sheets, if you need a finished dashboard with no spreadsheet setup, or if you need spreadsheet edits pushed back into Amazon, Shopify, or Walmart.
Gorilla ROI is downstream only by design. It pulls data into Sheets for review and analysis. It is not a write-back tool for changing marketplace records from a shared spreadsheet.
For the full category decision, use the Gorilla ROI alternative guide.
Gorilla ROI FAQ
What does Gorilla ROI do?
Gorilla ROI pulls ecommerce data into Google Sheets so your team can build sales, inventory, order, fee, refund, ad, Shopify, Walmart, and margin views from structured spreadsheet rows.
Is Gorilla ROI a dashboard tool?
No. Gorilla ROI is a Google Sheets data hub for ecommerce operations. It gets the rows into Sheets. Your team builds the charts, review tabs, margin logic, and weekly views.
Does Gorilla ROI require coding?
No. The main workflow is point-and-click inside Google Sheets. You choose the source, report, date range, and destination tab. Formulas are available for advanced users who want cell-level control.
Is Gorilla ROI still formula-based?
Gorilla ROI still supports custom spreadsheet formulas as advanced features, but the main product workflow is point-and-click data loading. Add formulas only when the workbook needs exact cell-level control.
Does Gorilla ROI work with Shopify and Walmart?
Yes. Gorilla ROI’s point-and-click connector collection includes Shopify Reports and Walmart Data, along with Amazon Seller Data and Amazon Ads Data. Point & Click Data Connector documentation
Can Gorilla ROI pull Amazon Ads data into Google Sheets?
Yes. Gorilla ROI supports Amazon Ads fields such as campaign name, spend, sales, orders, ROAS, ACOS, clicks, CTR, impressions, and CPC where available by report type. Gorilla ROI supported data
Who should avoid Gorilla ROI?
Avoid Gorilla ROI if your team does not use Google Sheets, if one monthly export still gets the job done, if you want a finished dashboard with no spreadsheet work, or if you need spreadsheet edits pushed back into your ecommerce platforms.