.svg "Gorilla ROI")

Article Summary
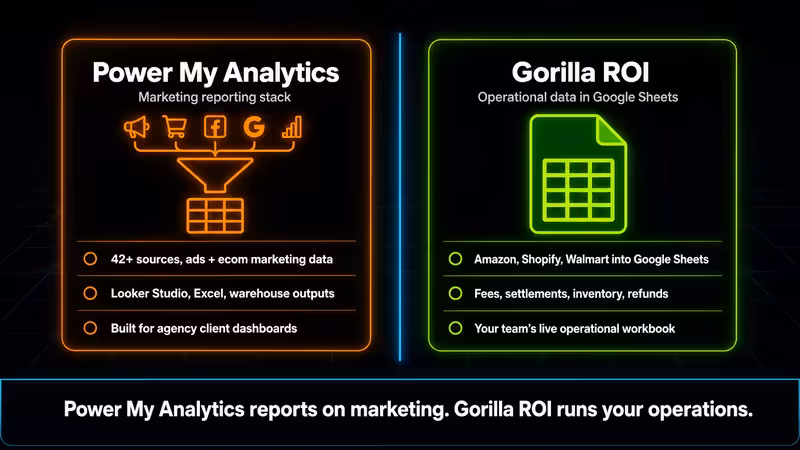
✅ Power My Analytics is a warehouse-backed marketing connector built for agencies and analytics teams. Cheaper than Supermetrics, wider in connector breadth, and genuinely good at what it does.
✅ We are an ecommerce Google Sheets data connector. We pull your Amazon, Shopify, and Walmart ecom data into your Google Sheet.
✅ If your team reports ad performance to clients, Power My Analytics may be a better fit. If your team runs margin, inventory, and SKU decisions in Google Sheets, test for operational data depth before choosing.
Power My Analytics vs Gorilla ROI direct comparison may surprise you.
For the broader comparison and alternatives list, see our Gorilla ROI alternatives guide.
I Read 83 Reviews. Zero Were From an Amazon Seller.
I went through every verified G2 review for Power My Analytics. Eighty-three of them at 4.5 stars. For their Amazon Seller Central connector, I looked at what each reviewer actually uses it for.
What I found: every single one runs ad performance dashboards for clients, combining Facebook, Google, and Amazon ad data into one client view. Not a single reviewer was an Amazon seller tracking margin by SKU, reconciling settlement deposits, or trying to figure out why their FBA fees went up last month.
That is not a complaint about the product. It is the product telling you exactly who it was built for. And that matters before you decide whether it fits your operation.
A Serious Tool. Built for a Specific Job.
Power My Analytics is stronger than a "cheap Supermetrics alternative" label. They offer compelling value. You can connect 42-plus data sources and route them to reporting outputs including Looker Studio, Google Sheets, Excel, BigQuery, and data warehouse paths.
Look at their connector page and you see the full marketing stack: Amazon Seller Central, Shopify, Walmart Marketplace, Google Ads, GA4, Search Console, Meta, LinkedIn, Klaviyo, Mailchimp, QuickBooks, and more. That is a real product with a real buyer in mind.
I looked up their pricing page. The Business plan starts at $49.95 per month and exports to Looker Studio only. You get five live data sources.
Their Pro plan adds Google Sheets and Excel as a destination, unlimited sources, ten accounts per source, and hourly refreshes. The Custom plan adds broader export and API options.
One detail worth knowing: Google Sheets is not in the base plan. It is a Pro plan feature. If Google Sheets is your main destination, actor that into the total before comparing against flat-subscription tools.
Look at their product page for the Amazon connector and it says "Amazon Seller Central marketing metrics." So you get the idea that their positioning is centered on marketing teams rather than the entire ecommerce life cycle.
And for that job, the tool works. Their data warehousing stores pre-pulled data, which is why their reports run faster than query-on-demand tools. For Amazon advertising metrics reporting inside Looker Studio or Power BI dashboards, they belong in your shortlist.
I have not used Power My Analytics unlike the other tools. But seems like reviewers love it for the agency dashboard workflow.
No Amazon Fee or Deep Reports
Here is what the marketing view of Amazon leaves out.
When you analyze and review how sales, profit, settlements, refunds, reimbursements for the week, you're going to need business reports, orders report, settlement transactions, refunds report, inventory health report, storage report, shipment report.
This is just the tip of the iceberg.
These are the types of reports that marketing analytics connectors don't offer in full detail as marketers are not interested in the operations side.
Here is how I see that gap showing up across a typical week of operational reporting.
If your main job is pulling Amazon seller data into Google Sheets for operational decisions, the question is not whether a connector exists. The question is whether the sheet becomes easier to run.
The Monday Test
A data connector passes the ecommerce test if your team can open your main spreadsheet on Monday morning, and know what to do without wasting 1-2 hours getting things updated from sales activity over the weekend.
Your team needs to:
- Pull Amazon sales data.
- Pull Amazon inventory data.
- Pull Amazon fee or settlement data if the connector covers it.
- Pull Shopify order data.
- Pull Walmart Marketplace data.
- Join all three by internal SKU.
- Build one sales view and one inventory view.
- Refresh the workbook.
- Hand it to the person who runs the Monday meeting.
Power My Analytics will definitely help show the marketing spend, ROAS across channels, customers acquired.
But will it be able to show you what to forecast for the week? The number of SKUs to ship out to 3PLs or fulfillment centers for the week?
Destination-First vs Spreadsheet-First
Power My Analytics starts with the reporting output. Choose your data sources, shape the data, send it to Looker Studio or wherever the report lives, with the spreadsheet as one option among several.
We start with the spreadsheet and prefer to keep it simple. Your Amazon, Shopify, and Walmart loads in structured rows without much set up or input. Your team and spreadsheets just get the data, and that's it.
Our focus is to keep things simple, give you the data that you need without features you won't bother using.
The Three Situations Where I Would Choose Power My Analytics
Again, I have not used it personally. I've seen plenty of videos to know how it works.
Agency reporting across client accounts: If your week involves building Looker Studio or Power BI dashboards for clients who want to see their Google Ads, Meta, and Amazon data in one place, Power My Analytics is built for exactly that workflow. Every reviewer who loves it is doing this job. It's an alternative to Supermetrics.
Amazon as one source inside a wider marketing stack: If getting Shopify sales next to ad spend in a Looker Studio dashboard is the goal, their Amazon connector fits that need.
You need Looker Studio, Excel, or warehouse outputs: We work through Google Sheets only. If your team does not live in Sheets, we are not the right call. Power My Analytics covers the outputs we do not.
Power My Analytics vs Gorilla ROI?
If you need data to your existing spreadsheets related to over 156 Amazon fee types, inventory movement, profit loss and margin details, look into what we offer as a data provider.
We earn our cost when your team already works from Google Sheets and the data retrieval is the bottleneck.
Questions Worth Asking Before You Commit
Is this a Power My Analytics alternative for ecommerce sellers?
For Amazon, Shopify, and Walmart data in Google Sheets, yes. For broad marketing reporting across multiple sources with Looker Studio outputs, no. Power My Analytics handles the second job and we handle the first.
Is Power My Analytics good for ecommerce?
It supports ecommerce as one data source among several in a marketing reporting setup. If your ecommerce data lives alongside ad metrics in a client dashboard, the connector works for that. If you need fee-level, settlement-level, and inventory-level operational data in Google Sheets for your own business, our data connector gets that done.
Which is better for Amazon data specifically?
Use Power My Analytics if Amazon is one source inside a wider marketing reporting setup. Use us if you need deep data access to Amazon sales, inventory, fees, refunds, and more SKU-level spreadsheet work.
Which is better for Shopify data?
Use Power My Analytics if Shopify is one connector in a wider reporting stack for client dashboards. Use us if Shopify needs to sit beside Amazon and Walmart in one ecommerce workbook.
Which is better for Walmart data?
Use Power My Analytics if Walmart data belongs inside a broad marketing dashboard. Use us if Walmart seller data needs to sit beside Amazon and Shopify in Google Sheets for weekly operating decisions.
Can I use both at the same time?
Yes, with clear distinctions. Power My Analytics running agency client dashboards in Looker Studio and us running the operational data in Google Sheets serve different people answering different questions. If you manage Amazon advertising for a brand and need both a client-facing ad performance view and an internal P&L, that combination makes sense.
Where do I see how you compare to the full range of options?
That comparison is here, covering the ecommerce data connector category.


.webp)