.svg "Gorilla ROI")

Article Summary

⭐ ALL AVAILABLE AT THE DOWNLOADS PAGE ⭐
What you'll learn
- Free Amazon FBA data google sheets to download and use
- How to organize and use these Amazon FBA seller templates
- The difference between each of the free Amazon FBA spreadsheets
This is a growing list of free FBA spreadsheets.
Make sure to bookmark and share for other sellers to benefit from the free FBA spreadsheets.
Why Amazon sellers should be using spreadsheets
Many software tools for FBA are popping up, but I believe that spreadsheets are necessary to give flexibility to the user.
Subscribing to software is great and there are many tools out there, but seeing how you can customize a car, home and pretty much most products, you should have the flexibility to use your own data in a way that makes sense to you.
You and I have different KPIs and the point of using spreadsheet tools is to create basic templates that you or your team members can use without interrupting your workflow.
As Google continues to enhance its Google Sheets application, the power of Sheets continues to increase. A few years back, Google Sheets could barely do the basics, but today, you have a full-blown spreadsheet application online.
Combine with Google Data Studio, Zapier, Slack and other apps and you have the tools and power to create internal apps and software processes for pennies.
How the spreadsheets are designed
I wrote about how I do spreadsheets here. This article will help as you can see and understand the architecture of the spreadsheets allowing you to extend it and create bigger, better versions of it.
Just remember to separate the data and the display tabs.
In all the free templates I’ve shared with you, there is a tab for entering the raw data, one that processes the data and one that displays the data.
Keep it like that and you’ll see how easy and quick it is to manage and use a spreadsheet, rather than the messy monsters you are likely used to.
Free Amazon FBA to Google Sheets growing list
So far, the list of google sheets for Amazon FBA includes:
Template name
- Amazon fee calculator
- Amazon profit and loss spreadsheet
- Analysis spreadsheet for detail page sales and traffic by child item
- Sales and traffic report dashboard
- Advertising report - customer search term analyzer
- Advertising report - targeting keyword analyzer
- Product attributes and details listing (Free Gorilla addon to pull data)
- Amazon detailed sales performance spreadsheet(Free Gorilla addon to pull data)
If you have a request for a spreadsheet, leave a comment, and I’ll see if I can make it and then add it to this list.
Or, if you have a spreadsheet of high quality that you want to add to this list, comment below also.
How to copy the free spreadsheets to your account
These spreadsheets are based on Google spreadsheets (from Google Drive or Google Docs). Not excel templates, but you can save and download these templates as XLSX (Excel template) and use it within Microsoft Excel.
Some of the advanced spreadsheets have formulas that Excel does not support straight away. If you don’t have strong skills with spreadsheets, it is best to stick with Google Sheets.
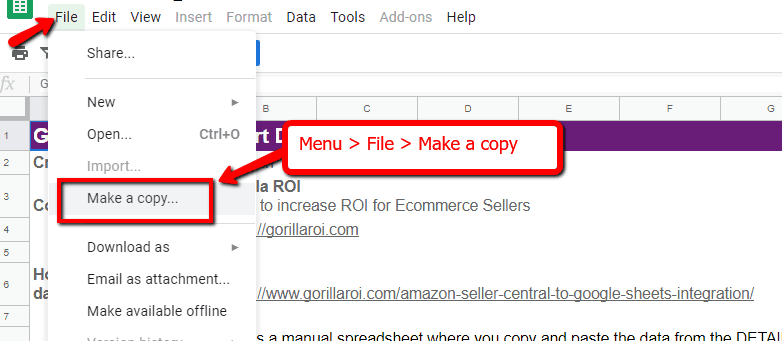
To copy any spreadsheet to your account:
- Click the link to the Google sheet that you want
- Click on File > Make a copy
- (do not select “Request edit access”)
Now onto the spreadsheets.
#1: Amazon Fee Calculator
➨ PREVIEW LINK: Preview link here
➨ DOWNLOAD PAGE: Spreadsheet link here
What is it?
If all you need is a simple Amazon Fee calculator based on weight and max length, this is for you.
Only two inputs required. Weight and length.
Nothing else like product costs, all dimensions etc which are a hassle to enter.
How it works
Watch the short 2 minute video. There are two sections. One for non-clothing and one for clothing. Everything else is self explanatory.
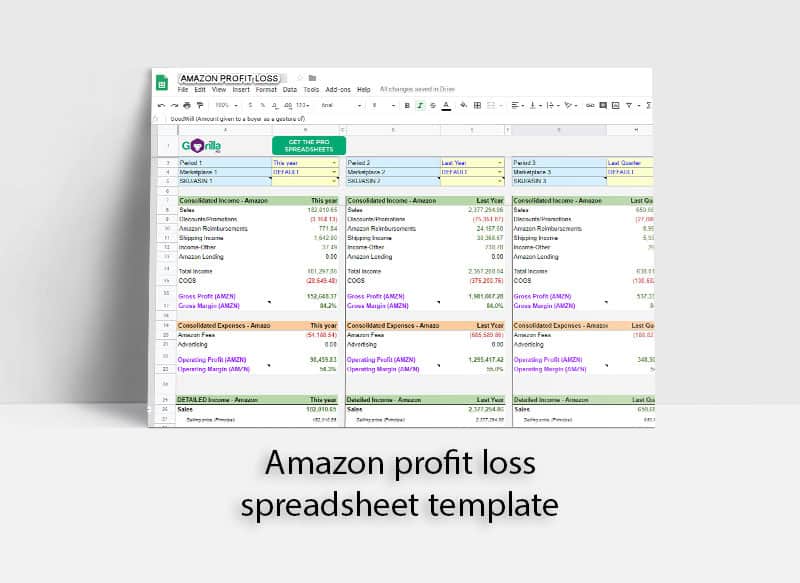
#2: Amazon Profit and Loss Spreadsheet
➨ PREVIEW LINK: Preview link here➨ DOWNLOAD PAGE:Spreadsheet link here
What is it?
Amazon has over 150 different Amazon seller fees and transaction types in their payment reports.
How do you know which one is which and properly account for them when you run your profit loss statements and taxes?
To organize your payment and transaction reports, it takes over an hour to consolidate and calculate.
Not with our template. Install Gorilla ROI (free addon available) and then use this template to automatically populate by SKU and many time period options.
Want to know your best seller profit and loss over the time period:
- last year
- this year
- last week
- last 30 days
- last quarter
- 2024Q1
- 2024Q2
- 2023Q3
- and more
Try doing this manually and you’ll spend forever trying to get the breakdown.
How it works
This spreadsheet is impossible to update manually. You probably tried to create your own profit/loss statement and gave up. That’s why you are here.
If you use Gorilla ROI addon to pull your data into the spreadsheet, follow the instructions on how to install and add any 3 of your SKUs.
Allow the addon to start collecting your Amazon seller data for a few hours, and then refresh the profit loss sheet and it will auto populate into the nice and easy to read P&L format you see in the screenshot.
Detailed instructions are here.
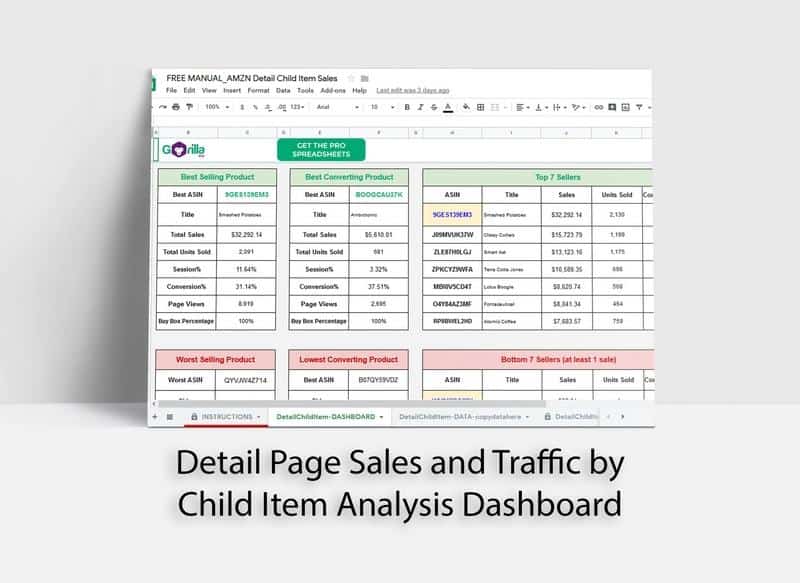
#3: Analysis Spreadsheet for Detail Page Sales and Traffic by Child Item
➨ PREVIEW LINK: Preview link here➨ DOWNLOAD PAGE:Spreadsheet link here
What is it?
Amazon is continuing to make it harder to find and understand data.
With this Amazon spreadsheet, it will automatically sort, reorganize and provide a dashboard to help you understand your data.
It takes your report and displays:
- Best selling product and associated stats
- Best converting product and associated stats
- Top 7 sellers, how much each generated in sales, the conversion rate
- Worst selling product
- Lowest converting product
- Bottom 7 sellers with at least 1 sale. Products with zero sales are ignored.
How it works
Instructions for these Amazon FBA google sheets are included in the spreadsheet, but here’s a quick rundown on how to import Amazon data to google sheets.
- Export your csv report from Reports > Business Reports > Detail Page Sales and Traffic by Child Item
- Copy the data from the csv file
- Paste it into the Free FBA spreadsheet where the tab says “data” or “copydatahere”. Make sure the column positioning matches the example.
That’s it.
Just copy and paste and the spreadsheet will take care of the rest. Let the spreadsheet become your Amazon sales analysis tool along with the rest of the seller spreadsheets here.
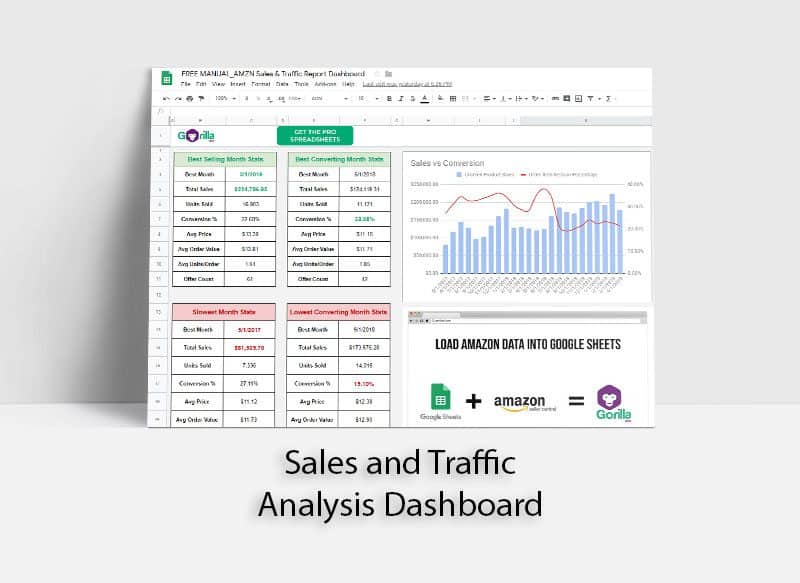
#4: Sales and Traffic Report Dashboard
➨ PREVIEW LINK: Preview link here
➨ DOWNLOAD PAGE:Spreadsheet link here
What is it?
Next on this list of free sales analysis tools is a Sales & Traffic Report analysis dashboard. It works very similarly to the Child Items Detail report above.
This template takes a higher level approach of analyzing and deciphering your overall business performance based on the Sales and Traffic report.
Once you copy this spreadsheet over to your account, you can copy and paste your data in it to quickly see:
- best performing month and stats for that month
- best converting month and stats
- slowest month and stats
- lowest converting month and stats
How it works
Instructions for this FBA spreadsheet are included in the spreadsheet, but here’s a quick rundown.
- Export your csv report from Reports > Business Reports > Sales and Traffic
- Change the settings to display your data in months, and then expand it to a 2 year view. A screenshot is included in the instructions inside the spreadsheet.
- Copy the data from the csv file
- Paste it into the FBA template where the tab says “data” or “copydatahere”. Make sure the column positioning matches the example.
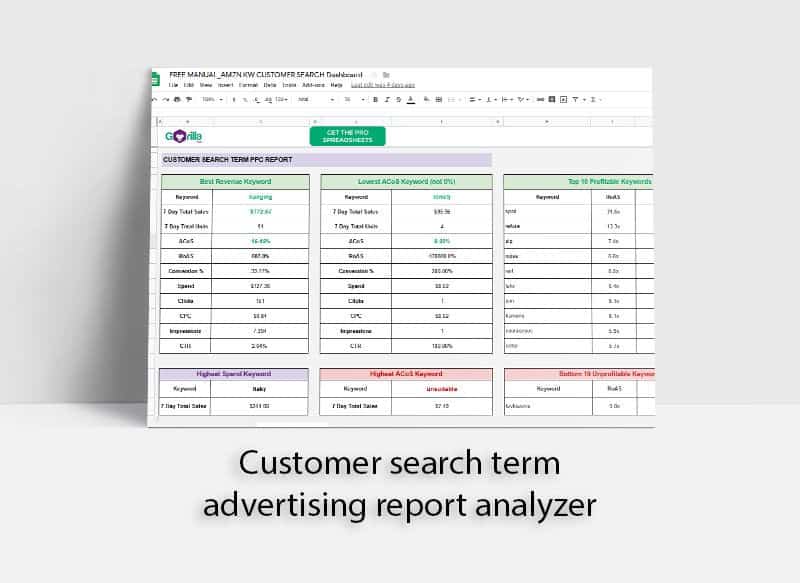
#5: Advertising report - customer search term analyzer
➨ PREVIEW LINK: Preview link here
➨ DOWNLOAD PAGE:Spreadsheet link here
What is it?
This is the first of two advertising report analysis spreadsheets you can download.
This spreadsheet is built for “search term” reports from your advertising reports page.
The two main exports are for “targeting” and “search term”. Search terms are the terms that customers type in and find your products. And because the columns and exports are slightly different, I’ve created two separate versions so you don’t get confused.
I’ve found that ROAS is the best indicator to use when filtering and analyzing your search terms.
ACoS breaks down if you don’t have any sales. You could end up spending $1,000 on a particular keyword, but if there are no sales, it will be blank and you’ll be left in the dark.
Note that this is a manual spreadsheet. So you have to copy and paste the data in from your CSV file. Automation will come later via the addon for Gorilla ROI.
With this seller advertising spreadsheet, you can:
- see key stats related to what customers are looking for
- see best revenue generating keyword
- see lowest and highest ACoS keyword
- see top 10 best and worst keywords
- see highest spend keyword
This type of analysis should help you figure out where you need to improve, or where your current campaigns are strong so that you can make it even stronger and box out competitors.
How it works
Instructions for this FBA spreadsheet is included in the spreadsheet, but here’s a quick rundown.
- Go to Reports > Advertising Reports
- Select “Sponsored Products”
- Select “Search term”
- Select your report period
- Create the report and then download the csv
- Copy the data from the csv file
- Paste it into the FBA template where the tab says “data” or “copydatahere”.
Make sure the column positioning matches the example.
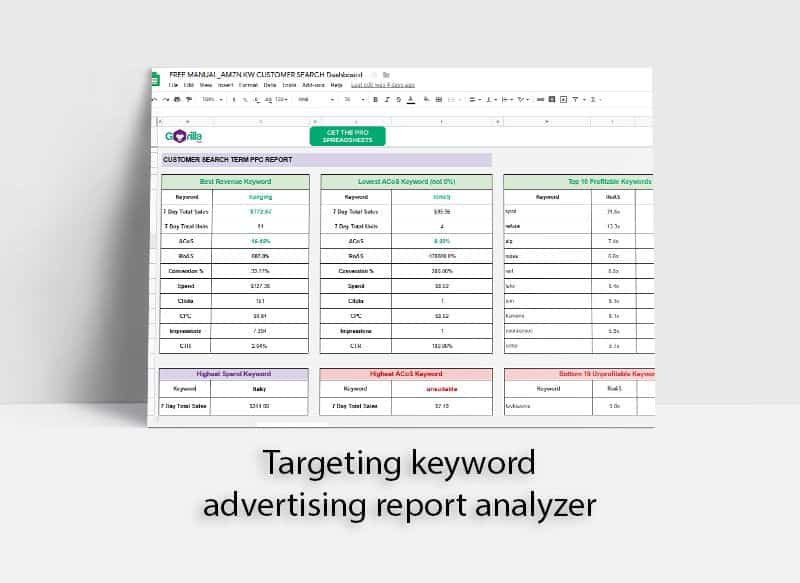
#6: Advertising report - targeting keyword analyzer
➨ PREVIEW LINK: Preview link here➨ DOWNLOAD PAGE:Spreadsheet link here
What is it?
This is the second of the two advertising report analyzer spreadsheets. While the customer search term spreadsheet above looks up the stats for the search terms your customer types in to the search bar, this one looks up the stats related to the keywords you currently have in your campaign.
Return on Ad Spend (RoAS) is the key filtering metric here. Focus on getting a higher RoAS number as it means your return is higher compared to the spend.
The way this spreadsheet has been designed is to make the data easy to understand and without having to click the same filter button so-many-times to do the same thing over and over again.
In order to automate this spreadsheet, it’s built with a lot of complex INDEX() and MATCH() functions. If you don’t know what you are doing, try playing around a little bit and undoing the changes to return it back to normal.
Once you figure out how this spreadsheet and the formulas work, you can create more “widgets” based on criteria you need to look up.
How it works
Instructions for this targeting keyword spreadsheet is included in the spreadsheet, but here's a quick rundown.
- Go to Reports > Advertising Reports
- Select "Sponsored Products"
- Select "Targeting"
- Select your report period
- Create the report and then download the csv
- Copy the data from the csv file
- Paste it into the FBA template where the tab says "data" or "copydatahere".
Make sure the column positioning matches the example.
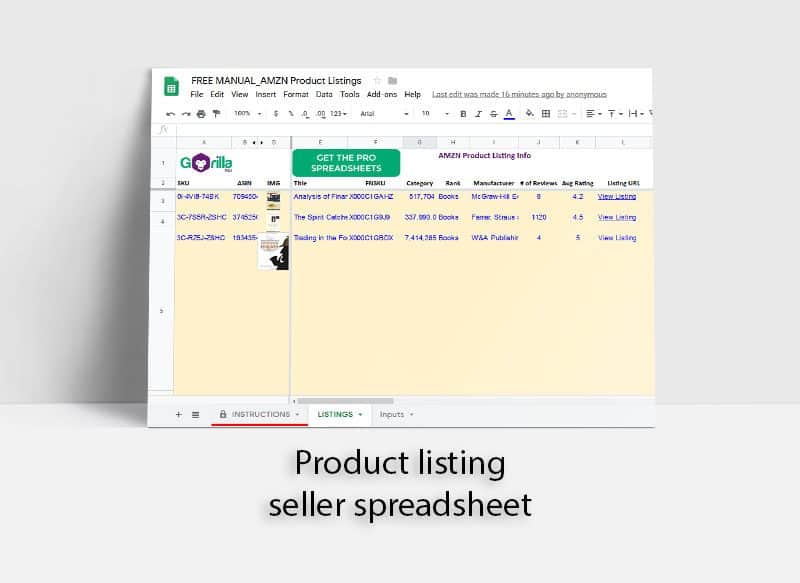
#7: Product attributes and details listing
➨ PREVIEW LINK: Preview link here
➨ DOWNLOAD PAGE:Spreadsheet link here
FREE GORILLA ADDON TO PULL DATA: Google Chrome page
What is it?
This is one of the basic spreadsheets I offer for all users of Gorilla ROI.
It’s a spreadsheet to track your listing information, category, URL’s review links and so on.
Think of it as a log to track your listing performance and how it does over time. You can update the numbers of this spreadsheet weekly, monthly or however often you want.
The real benefit of this is to combine it with Gorilla ROI addon to automatically pull all of your data into the spreadsheet.
How it works
If you manually update the spreadsheet, it's very easy to figure out. Enter the info into the tab "LISTINGS" as often as you want.
If you use Gorilla ROI addon to pull your data into the spreadsheet, follow the instructions on how to install and add any 3 of your SKUs.
Allow the addon to start collecting your Amazon seller data for a few hours and then it will start populating the spreadsheet.
Detailed instructions are here.
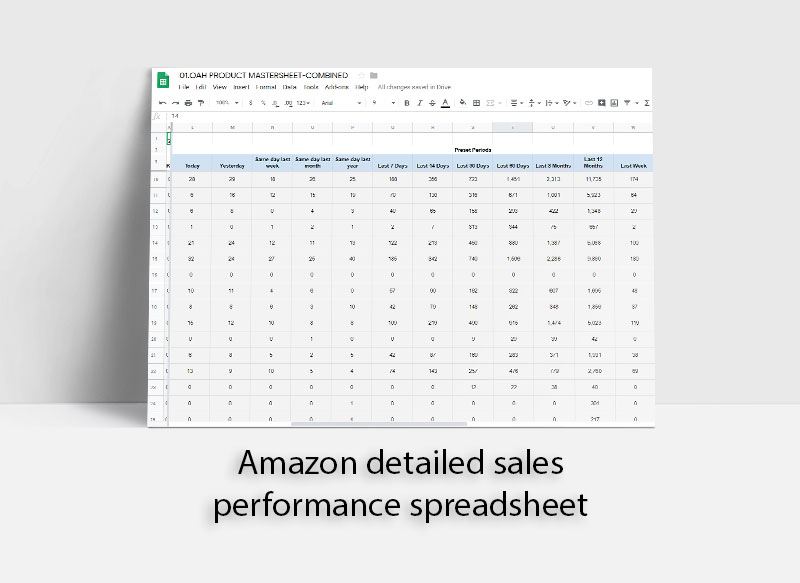
#8: Amazon detailed sales performance spreadsheet
➨ PREVIEW LINK: Preview link here
➨ DOWNLOAD PAGE:Spreadsheet link here
FREE GORILLA ADDON TO PULL DATA: Google Chrome page
What is it?
Don't judge this spreadsheet by the image above.
Because it's one of the most sought after and requested spreadsheets. This sales spreadsheet automatically pulls, loads your data and displays it over 25 preset periods.
If you want to get a granular breakdown of your sales performance, look no more.
Just look at the different preset time periods you can pull for your seller sales.
- Today
- Yesterday
- Same day last week
- Same day last month
- Same day last year
- Last 7 Days
- Last 14 Days
- Last 30 Days
- This week
- Max
- This month
- This quarter
- This year
- This Year-to-Last-Month
- Last Week
- Last Month
- Last Quarter
- Last Year
- Last 60 Days
- Last 12 Months
- Last 7 Days Week Ago
- Last 7 Days Year Ago
- Last 30 Days Month Ago
- Last 30 Days Year Ago
- Last Week Year Ago
- Last Month Year Ago
- YYYY-MM (set format as text)
- YYYYQ1… YYYYQ4
Trying to get this manually to understand and dig into your data will be a nightmare.
The spreadsheet includes the formulas required to get this information from your seller central account data. All you have to do is install the Gorilla ROI addon, activate it and away you go.
With this type of breakdown, it helps you see how your business is doing. Rather than procrastinating or wasting time (which is money) to do it manually or not doing it at all, you can keep track of sales and jump on things that need attention.
If you want to see how deep and granular you can go, check out the preview above. It's a version that all Gorilla ROI members get along with other special spreadsheets and dashboards to make life easier as an FBA seller.
How it works
This one is not a manual spreadsheet.
There is simply no way you can update this manually. And that's the point. Data like this should be automated.
Follow the instructions on how to install and add any 3 of your FBA SKUs. FBM is not supported.
Allow the addon to start collecting your Amazon seller data for a few hours and then it will start populating the spreadsheet.
Detailed instructions are here.
#9: What other spreadsheets do you want?
I love creating free Amazon FBA spreadsheet around here. Whether it be for Google Sheets or for Excel, spreadsheets are not going away anytime soon.
Rather than just creating spreadsheet templates that are nothing but some titles, I want to create functional tools for FBA that you can use.
If you have ideas or a request, leave a comment below.
I will continue to make spreadsheets and add them to this free spreadsheets resource page.
Make sure you bookmark it or share it with others. The more demand, the more FBA templates I'll offer.
For dedicated Excel resources and templates, Vertex42 has a large collection of spreadsheets you can download and use.
Frequently asked questions
Does this work for Excel?
- All the Amazon spreadsheets you find here are created for Google Sheets. You can save them as excel format, but there will be formulas that need to be converted to MS excel format. Functions like QUERY() are not supported in Excel and you'll have to whip out advanced techniques like power queries to run the same thing. Or a lot of VLOOKUPS, INDEX, MATCH functions.
What other spreadsheets and tools do you offer?
- We offer a suite of ready to go Business Pro Spreadsheets and documents to improve your FBA operations. Things like forecasting calculators, inventory analysis sheets, manufacturing agreements in Chinese and English and so on. The suite of spreadsheets and docs continue to grow and it is lifetime access for a single payment. We have an Amazon inventory management system spreadsheet for free using Google Sheets.
Do you provide support for these spreadsheets?
- I've created these spreadsheets so that people of any level can use them. I take a software engineering approach to create very easy to use spreadsheets and you will see how easy it is once you open them up. I'll continue updating these spreadsheets if Amazon changes their reports or formatting.
Do I need the Gorilla ROI addon for these spreadsheets to work?
- Not for all. The spreadsheet for product listings and detailed sales performance is best with the addon. The addon is free for any 3 of your FBA SKUs and if you can automate the process, what have you got to lose? Takes a minute to install and if you don't like it, just uninstall it.
Can I share these spreadsheets with others?
- Yes, you can share it with your team, family, friends and whoever else may benefit from having a free Amazon FBA spreadsheet. Please don't remove the attribution as I have spent a lot of time making these spreadsheets and would hate to take it down if people are found to be claiming they made the spreadsheets.
Do you make custom spreadsheets for Amazon sellers?
- No. I do not offer custom services. My team does offer support and custom integration into your existing spreadsheets if you sign up to use Gorilla ROI and purchase the Support and Warranty package found in your account.