.svg "Gorilla ROI")

Article Summary
✅ Help sellers understand the minimum sales required to cover all expenses (COGS, fixed & variable costs) and not lose money.
✅ The calculator doesn't account for various costs specific to online sellers like Amazon fees, returns, and advertising.
✅ A downloadable break-even calculator spreadsheet.
This is a spreadsheet template that you can create on your own and can be applied to any sales channel. Not just limited to Amazon
This break even calculator spreadsheet is available as part of the PRO Amazon Business Spreadsheet Package.
What is the break-even point?
The simplest definition of breaking even, is to make enough profit to cover all expenses.
But this definition isn't helpful for Amazon or online sellers who are trying to figure out whether a product is worth adding to their portfolio.
It's like telling a first time driver to put one foot on the accelerator and press down to drive.
Utterly useless in real life.
That's the problem with many break-even calculators and analysis because it doesn't clearly define or break down the details for you and it is too generic.
I'll share all the details with you and more. If you make it through the entire article, you'll be able to nail it when analyzing your product and calculating the break even point.
Why a break-even analysis is vital
I'm going to use Amazon as the example sales channel. The concept and calculations are the same for ebay, Walmart, Etsy, Craigslist etc.
You've done all the work and know what product you are going to sell.
- Finding a niche
- Finding a supplier
- Negotiating with the supplier
- Received samples
- Tested the samples
- Made some custom changes to the product
- Designed the packaging
Now you are ready to order, but before you go any further, it's imperative that you've performed your break-even analysis.
If you think it will cost $1000 to get the product to your warehouse/home/business, it doesn't mean you only have to sell $1000 to break even.
This is how newbies lose money. I wasted $70k because I didn't know how to do a break even calculation properly. I underestimated everything.
Every detail that adds to the landed cost of the product must be identified. Your original estimate of $1000 could mean you need $10,000 in sales to break even.
Don't allow yourself to be surprised. Follow the formulas and examples below.
How to calculate the break-even point of a product
The standard method of calculation is to use a fixed cost, variable cost per unit, sales price per unit and quantity sold.
I don't like this because it's mainly for service-based businesses.
Standard break-even formula method
E.g. you run a dentistry. The fixed cost per month is $10,000. Dentists are paid $50 and hour, clients are charged $100. What's the break even revenue?
Break-even Sales = Fixed Cost / [1 - (cost ÷ sales price)]
10000 / [1 - (50/100)] = $20,000
Dentistry needs to make $20,000 in sales each month to break even.
But how does this apply if you are trying to figure out whether a PRODUCT is going to break even or not?
That's where our version of the Break-even calculator comes into play for Amazon and online sellers.
Breakeven formula for Amazon and online sellers
I keep it simple and to the point.
minimum break-even point is:
Sales = COGS + Total Expenses
You get back what you spend. You don't make any money, you don't lose any money.
Let's say you are importing Tennis balls from China.
The basic theory and formula to break even is this:
SELLING PRICE = TOTAL COGS + TOTAL EXPENSES
Break-Even Point is when: SALES = COGS + EXPENSES
Profit is when: SALES > COGS + EXPENSES
HUGE Losses occur when: SALES < COGS + EXPENSES
If you can't break even, you will bleed money because your operating and net profit is based on your expenses. Break even point is when you net profit is $0.
If you don't factor in advertising, lease, insurance and other costs to run your business, you will be minus when you run your accounting numbers.
Another random example of the opposite case.
- Gym weights COGS = $10.00
- Landed COGS = $15 (after all taxes, tariffs, fees, commissions, shipping)
- Selling price = $30.00
- Gross profit = $15
And a 50% gross margin looks good, but this is a case where no expenses are factored in.
- Cost to ship to Amazon or your customer could be $50
- Return rate could be 5%
- Promotions eat up 3%
- Advertising takes 10%
The gross profit may remain at $15, but the operating expenses for this is now somewhere around $55.40.
Oops...
The more you sell, the more you lose. Hence the reason why it's vital that you know your numbers.
How to enter fixed and variables costs to the formula
Think of fixed costs as the expense required to run your business.
Regardless of whether you sell anything, you have to pay for the things like:
- lease
- electricity
- waste disposal
- insurance
- maintenance
- equipment
- payroll
- bookkeeping
- and so on
These are your fixed costs. It mostly stays the same.
But entering the total sum like $1500 or $7000 is not the best practice.
Why?
If you already have 9 products and you are looking at your 10th product, the 10th product is not supposed to cover all your business expenses. The costs should be spread out and shared across your entire portfolio of 10 products.
You do this by entering your operating costs as a percentage.
OPERATING MARGIN = Total Operating Expenses ÷ Total Revenue
If you use cash basis accounting, it could be 20-30%.
If you use accrual basis accounting, it could be 15-25%.
This percentage is then applied to the selling price and used as the fixed+variable cost.
E.g. If Tennis balls selling price is set to $10 with operating costs at 15%, then $1.50 will be used up for fixed and variable costs.
By using a percentage, you can keep it consistent across all your products, and also easily adjust it based on how your business is doing.
If your business is booming and margins are increasing, you can decrease the percentage a little. Or if expenses are going up, increase the percentage.
Much better than going over your statements and summing up expenses all the time.
When you factor in fixed and variables costs like referral fees, return rates, operating costs, you are calculating your operating income. For most businesses, the operating income is very close to the net income.
(Operating income is NOT net income. You must pay taxes on operating income. Net income is the profit after taxes. Don't confuse the two and end up with a nasty surprise.)
PRICE - COGS - Fixed & Variable Costs = OPERATING PROFIT
Best Break-Even Point is when: OP PROFIT = TOTAL COGS
Best Profit is when: OP PROFIT > TOTAL COGS
Losses occur when: OP PROFIT < TOTAL COGS
All break-even point formulas of a product
Break-even sales = COGS + Fixed & Variable Costs
Break-even units = Break-even Sales÷ Selling price
Break-even months = Break-even units÷ Est units sold per month
Gross Profit per unit = Selling price - COGS per unit
Gross Profit Margin = Gross Profit per unit ÷ Selling Price x 100
Operating Profit per unit = Selling price - COGS per unit - fixed & variable costs per unit
Operating Profit Margin = Operating profit per unit÷ Selling price x 100
Break-even spreadsheet calculator
Click the image to see the published full size and preview of the break-even calculator.
- Preview link
- This break even calculator spreadsheet is part of the PRO Amazon Business Spreadsheet Package.
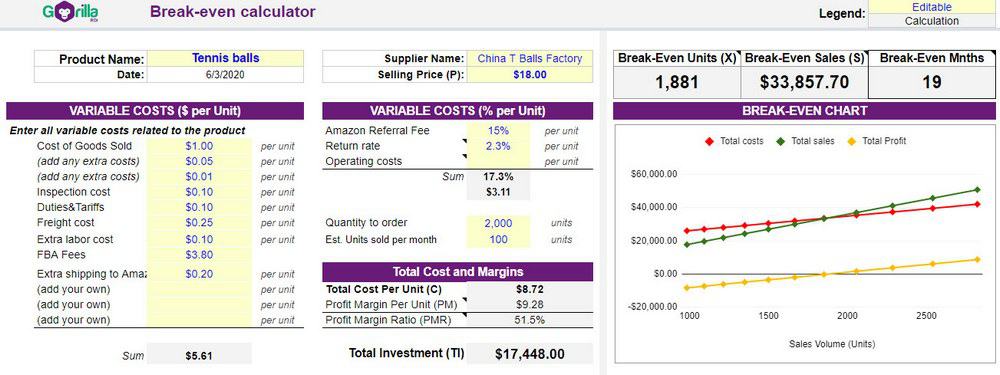
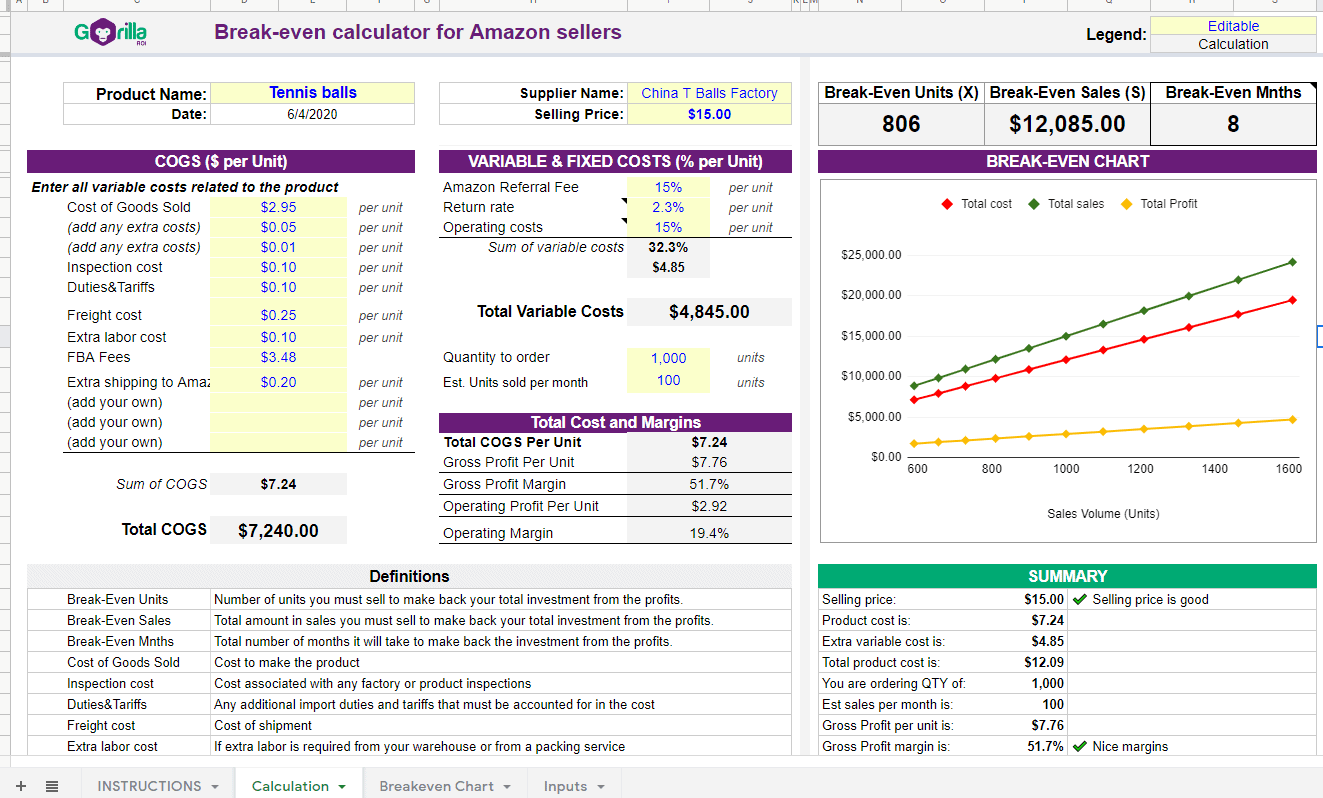
This calculator is split up into 3 sections.
- Your COGS
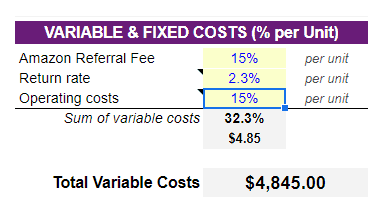
- Your Variable & Fixed Costs as a %
- Break-even analysis and chart
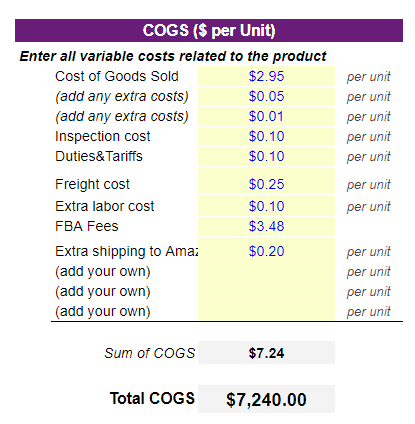
Under the COGS section, add all break downs associated with your COGS. The more detailed the better. It's a spreadsheet so you can edit the labels.
The sum of the COGS is shown at the bottom.
The variable and fixed costs section is the same as explained above. Enter it as a percentage of your total sales.
It will then calculate the dollar amount based on your selling price. Variable costs are always changing based on your selling price as it is based on a percentage.
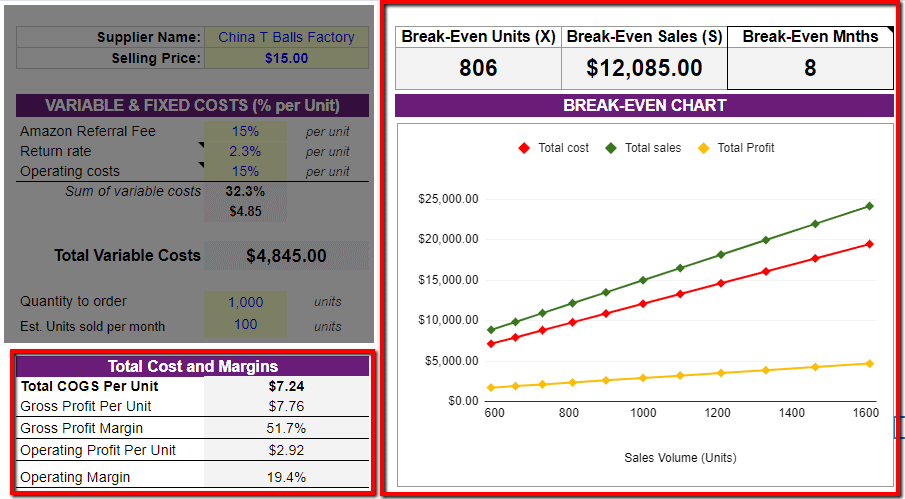
Based on your COGS and costs, the break even analysis shows the margins based on the selling price, and the right chart shows how many units you'll need to sell to break even, the total sales you need to break even and how many months it will take to break even.
Here's a video explanation of the break-even spreadsheet.
Break even calculation definitions
Break-Even UnitsNumber of units you must sell to make back your total investment from the profits.Break-Even SalesTotal amount in sales you must sell to make back your total investment from the profits.Break-Even MonthsTotal number of months it will take to make back the investment from the profits.Cost of Goods SoldCost to make the productInspection costCost associated with any factory or product inspectionsDuties&TariffsAny additional import duties and tariffs that must be accounted for in the costFreight costCost of shipmentExtra labor costIf extra labor is required from your warehouse or from a packing serviceFBA FeesPer unit FBA fees for pick and packExtra shipping to AmazonExtra costs to ship the item to AmazonAmazon Referral Fee"}">Amazon Referral FeeThe % fee for your Amazon product categoryReturn rateThe return rate for your account. Find it in your business sales report in seller central.Operating coststaxes, travel, rent/lease, maintenance, licenses, supplies, software, hardware"}" data-sheets-note="Rules of thumb ------------------ 15% of Revenue as Expenses = Efficient Business Prioritizing Profits 20% of Revenue as Expenses = Moderately Efficient Business, Also reinvesting heavily (majority) 25% of Revenue as Expenses = Inefficient Business. Lots of mistakes. Reinvesting everything and more.">include if you want to calculate break even after accounting for returns.
Delete if you want to calculate break even based on gross profit only.
includes business and overhead expenses like:- Advertising, payroll, utilities, rent, legal, fees and interest, marketing, taxes, travel, rent/lease, maintenance, licenses, supplies, software, hardware
Total Cost Per UnitThe total sum of the landed cost and extra variable costsProfit Margin Per UnitProfit in dollarsProfit Margin RatioProfit as a percentage. If operating costs are excluded, it's closer to a gross profit margin. If operating costs are included, it is Operating Profit.
Other break-even calculators
Standard break-even calculators
- https://www.nase.org/business-help/calculators/business/breakeven-analysis-calculator
- https://www.nase.org/business-help/calculators/business/breakeven-analysis-calculator
Break even calculators for online sellers and Amazon sellers