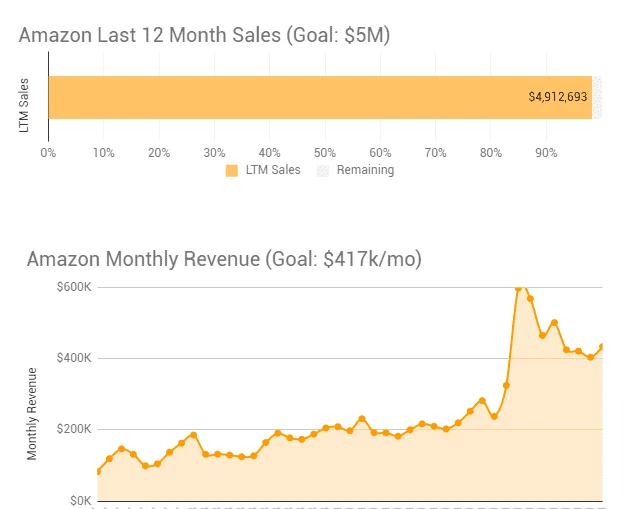
Here’s the current Gorilla ROI Amazon sales progress. To see the interactive version, go to our income reports page.
Note: These monthly updates are for educational purposes.
Article Summary (TL;DR)
✅ Explore the performance metrics and milestones achieved in November for our FBA business, reaching $433K in sales.
✅ Gain insights into the challenges faced and lessons learned during the month, highlighting opportunities for improvement and future growth.
✅ Learn about the strategies implemented to drive sales growth, including inventory management, pricing optimization, and marketing efforts.
Skipping October. Onto November stats. You can see the revenue number for October in the image above or on the income reports page.
Agenda in this post.
- Metrics used throughout the year
- Business goals update and hitting $5M
- Shipping costs and delays
- Build an Amazon business with an exit plan
- New highly requested Gorilla ROI functions and data
First, the numbers as usual.
November stats
- $433k in sales
- 97% growth from the same month last year
- 7% growth from the previous month
- Conversion rate of 35%
- ACoS is 25.5%. TACoS isn’t fully available yet but will be around 9.5%.
- Sales to Inventory ratio of 1.42
Metrics I use to track and monitor our business
Although I track a lot of numbers, I like to keep it as simple as possible. There are only so many metrics that you can follow and act on.
The ones above are the main big picture stuff. Sales, growth rates, conversions and PPC related as it is the number one expense.
Amazon continues to come up with their own metrics like IPI, account health, and NCX rate. These are metrics that are valuable to Amazon in order to keep slow-moving inventory out of their warehouses and supply chain.
If you don’t track the specific numbers for your business and rely on Amazon to tell you what to track, you’ll constantly be in reactive mode, versus active mode. You can use the Amazon fee calculator to monitor your margins and profits, but you need more insight to truly understand your business than just fees and profit.
Amazon’s implementation of Inventory Performance Index is calculated by
- Excess inventory
- Sell-through
- Stranded inventory
- In-stock inventory
However, these were KPIs (Key Performance Indicators) that our warehouse and operations team already targetted before Amazon created an index for it.
When Amazon rolled out their IPI, our score was on the high end like most of you, and we weren’t caught off guard and being asked to remove inventory. We had inventory in Google sheets updated daily to stay ahead.
Likewise, Sales to Inventory is a number I track monthly as a super easy and quick way to verify we aren’t going overboard with inventory stock levels across the organization.
As we hold inventory outside of Amazon, it’s just as important that I track the total inventory movement across our locations versus, Amazon’s inventory numbers alone.
Holding 1-3 months of extra inventory for best selling products is a no brainer in the current selling environment.
Not so for slow movers.
In November, our sales-to-inventory ratio was 1.42. For every $142 of sales, we had $100 of inventory.
Rather than just watching the vanity metric of “sales” without context, this ratio checks
- sales
- inventory levels
- efficiency of assets
- margin trend
4 insights with a single number. Not bad.
The higher the number, the better of course.
The goal is to know what KPIs are required for each department. For example, it doesn’t make sense for my warehouse team to monitor ACoS. It doesn’t help them in any way.
With that in mind, here’s a presentation I did a few months back about the numbers I use all the time.
Business goal update and hitting $5M
We’ve hit $5M this year.
It’s not official on the chart above, but we are at 100% growth above last year, meaning we are in the $5M club.
First things first. $5M was just an arbitrary number that seemed big. Something my wife and I could push towards and not get complacent or lazy. COVID helped. Can’t deny that.
The second thing is that, going from $1M to $5M wasn’t that big of a change in how we ran things. We still have many of the same processes, I’m still able to easily manage my numbers, inventory, reports, and such through Google Sheets and Gorilla ROI.
Our team is essentially still the same. We didn’t have to hire 10 more people just to go from 1 to 5. We were able to hire temps to get through the busy months. Then again, going to $10M will need new members in a couple of specialized areas, but not a whole bunch.
We sell <$20 products, which means 5x volume. Space is always the major issue for us. How we can stay in our space for the next several years is going to require tons of juggling.
If you do >$20 products, then the operational impact will be even less.
The point is that if you are already beyond $5M, you know what I’m saying is true.
If you are in the early stages, it’s not too different from where you are. If you are growing quickly, you’ll figure it out easily. It’s not rocket science. Keep at it.
For next year, we have a great pipeline of new products we’ve created. All custom made. China can’t copy it.
If it doesn’t work out, that’s on us and I can’t complain about copycats. If they all flop, the business should at least be where we are today as it looks like we have a steady baseline.
If the new products work out, we could be knocking on the next milestone of $10M.
Brings me to my question to you.
Are these sales reports worth writing?
- Do I keep writing about the same things?
- Are the topics too high level for you to get anything out of?
- Is it worth spending the time to write this?
Who knows, the December update may be the last one for the sales reports depending on what people say.
You tell me.
Shipping costs and delays
If Amazon delays and restock limits aren’t bad enough, booking a container from China to US is brutal.
- prices are 2-3x higher
- speed is slower
- customs checks have increased
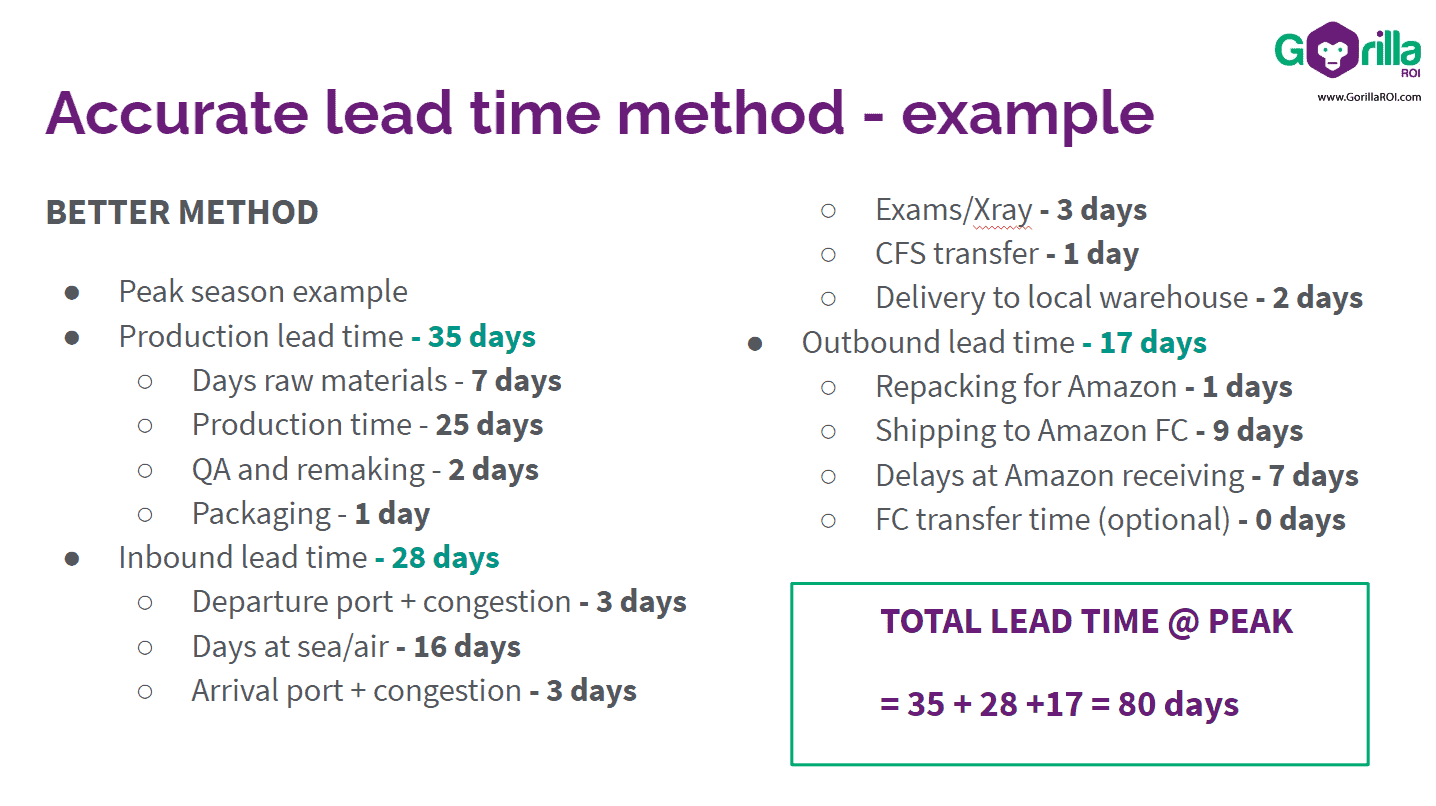
Go through my detailed lead time calculation tutorial to see how bad it can get. There’s a spreadsheet to download too.
We also released the much-requested INVENTORYRESTOCK() function that pulls in all your restock report data. You can finally stop downloading those restock reports and load it straight from your Google Sheet.
The short version is that with the extra delays + Chinese New Year + Amazon inbound delays, it could easily be an extra 50 days added to the true lead time.
That’s not an exaggeration.
Some people still don’t have their pallets checked in for over 1 month. Just sitting on Amazon’s FC dock.
We were able to stay in and ahead of stock by accounting for the extra delays. Looks like I have to add more buffer to my own lead times.
I did think that I was safe with my US manufacturers, but surprise surprise.
They are dependent on China to get bottles and other components. Lead times for US manufacturers have increased just as much for many industries.
Build an Amazon business with an exit plan
When starting on Amazon, most people think about replacing their day job. A lifestyle type of business.
But Amazon FBA businesses are hot right now.
This only applies to certain FBA businesses. If you have your own brand and unique product line, the multiples are strong for an exit. There is a lot of money out there looking to snatch them up.
Doing arbitrage, reselling etc? Not so much.
If you to go any of the big brokerage sites like Empire Flippers, you’ll see a lot of FBA businesses on sale. And they are selling quickly.
Companies like Thrasio are gobbling up FBA businesses at the moment. Similar companies are being created in Europe with the intention of buying as many good branded FBA companies as possible.
With such a clear exit plan available, it’s best to make sure you can take advantage of it.
- Sick of dealing with seller support?
- Want to get upfront cash buyout?
- Need to take time off?
- Bored of Amazon and seeking something different?
You have many options now. Keep them open. Very different to even several years back, when selling was difficult and options were limited.
Highly requested Gorilla functions and data
We’ve been busy adding more important data points to make your life easier.
-
NEW: Get inventory age for a SKU or ASIN. GORILLA_INVENTORYAGE() See how stale your inventory is at Amazon.
-
NEW: Get restock report data (US marketplace only) GORILLA_INVENTORYRESTOCK(). You can get your inventory utilization, max ship quantity and recommendations.
-
NEW: We've simplified CHARGETOTAL() and FEETOTAL() with this new version GORILLA_FINANCES() - makes it easy to create a table for your P&L.
-
NEW: Gorilla ROI Developer ID for US/CA/MX/BR.
-
Our page of examples and documentation is always being updated. Easy navigation version and one page version.
More free Amazon FBA spreadsheets for all
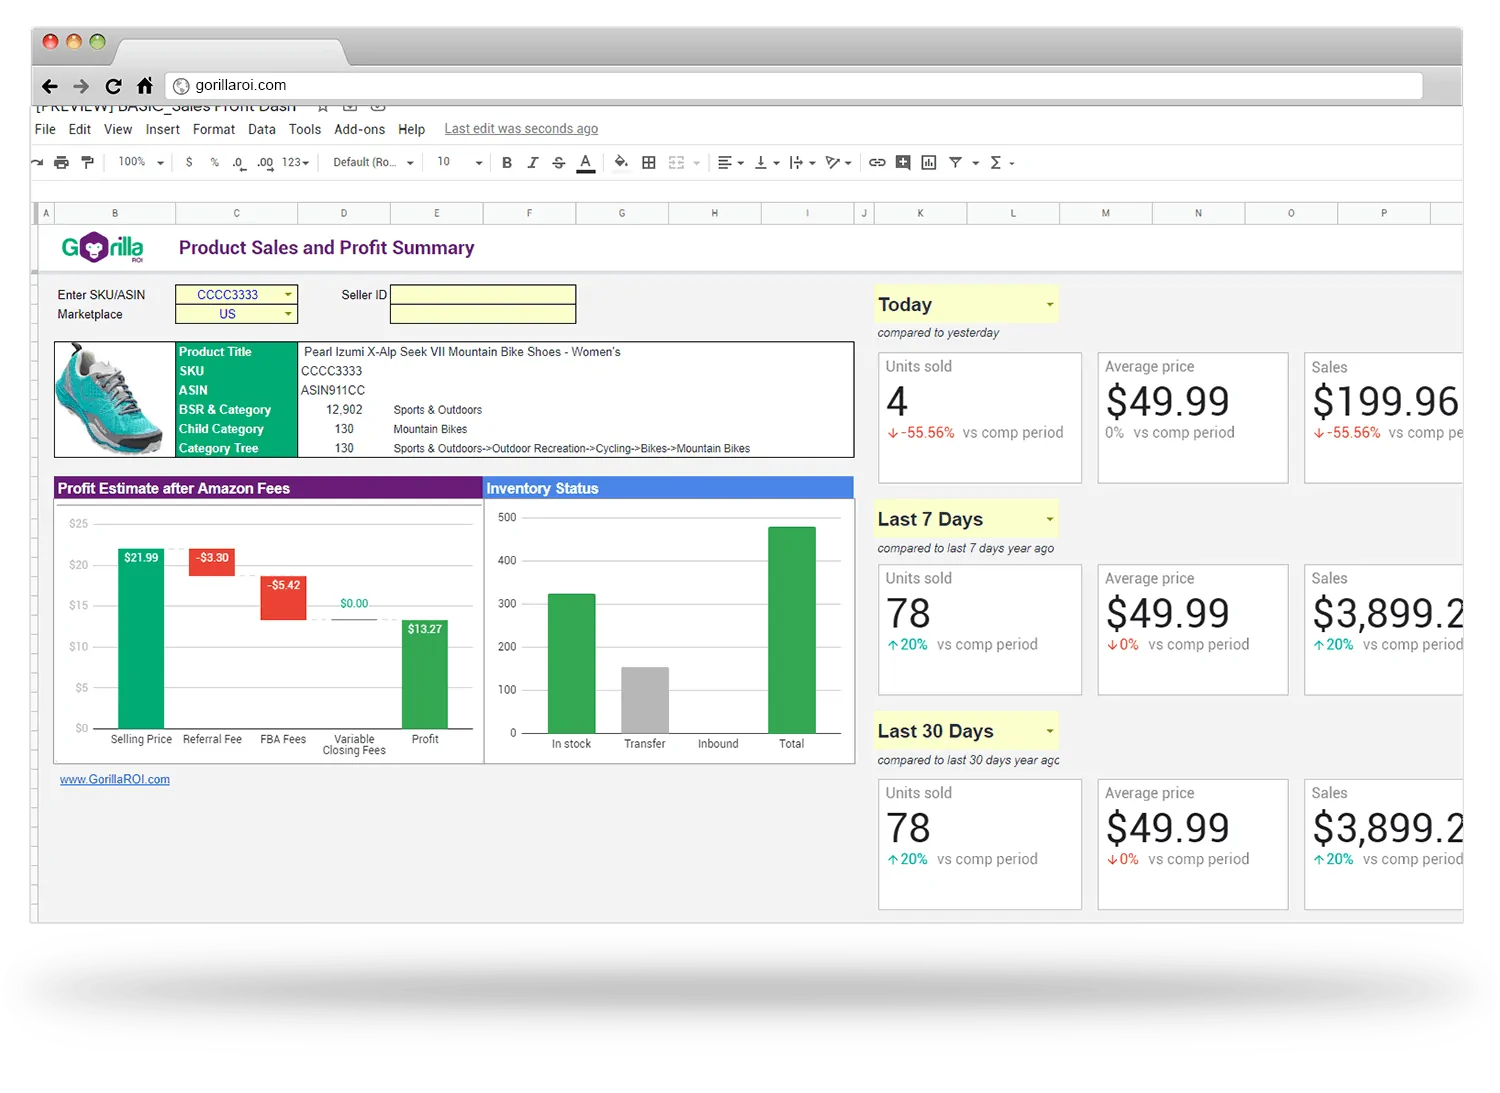
We’ve added more templates for both basic users and PRO spreadsheet buyers. More free Amazon spreadsheets are being created too.
You can download it immediately without having to sign up for anything.
Just copy straight to your account.
If you want to get updated data straight into your own Google sheets, you can use Gorilla ROI for your Amazon seller central integration. It makes work so easy when you don’t have to manually update data or log into accounts constantly and wasting time.
Comments
Related Posts

Shopify eBay Integration for Busy Sellers: Sell Like Crazy Across 2 Channels
Using an omnichannel sales strategy can help your business reach…

Boost Sales With Shopify Automation – BONUS: Our 3 Best Shopify Automation Apps
Being an e-commerce company, in particular, means that you have…

Streamline Your Success: Mastering Shopify Warehouse Management in the Digital Age
Your Shopify store is booming, orders are flooding in, but…


Leave a Reply