Article Summary (TL;DR)
✅ Gain insights into sales forecasting, inventory management, and seasonal adjustments to optimize business performance.
✅ Understand the significance of seasonally adjusted forecasting to prevent over-ordering or under-stocking, improving business control and efficiency.
✅ Learn how going out of stock impacts your bottom line and discover strategies to avoid it, especially critical for Amazon FBA businesses.
If you’ve been struggling with any of the following:
- Figuring out how to calculate sales forecasts
- Understanding the ebbs and flows of your business sales
- Knowing when to restock inventory
- How to account for seasonal changes
- Using clunky spreadsheets…
You will walk away as the Yoda of sales forecasting. Today is the day where the dust settles on sales forecasting.
Whether you run an Amazon FBA business, Shopify or Woocommerce store or traditional brick and mortar, projecting your sales and revenue along with inventory will be a lot easier.
I’m also going to give you a Google Sheets sales forecast template you can take with you.
Let’s begin.
Why Big Sellers Forecast
Losing money sucks.
One of the hidden ways of losing money is by going out of stock.
It’s one of the worst things because you don’t see it. You may not feel it, but it severely impacts the bottom line.
Especially with an Amazon business because if you run out of stock:
- Your rank goes down
- Your momentum drops
- You need to spend more on PPC to regain your position
- Competitors will sell their products while you are out of stock
- Competitor ranks could go up
Our business in this area has improved exponentially after utilizing the check in/out spreadsheet (also in the PRO Spreadsheet package) as well as the inventory tracking spreadsheet.
But the missing piece was not being able to forecast based on seasonality.
Our products are fairly consistent all year round, but end of year sales obviously increase.
So how much and how early do I prepare for shipment so that I won’t go out of stock?
Enter seasonally adjusted forecasting.
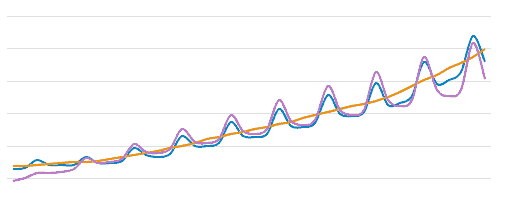
- The blue line is the actual sales data with peaks and valleys.
- Purple line is the forecasted data which does a good job of mimicing the demand.
- Orange line is a linear forecast. The bigger the swings between peak and valley, the bigger the trouble linear forecasting will get you into.
If a product is seasonal, you don’t want to be over-ordering or over-sending.
🗣️ Pro Tip: Do what the big sellers do and start forecasting with seasonally adjusted number to better manage and control your business.
Here’s how.
Sales Forecast Dashboard
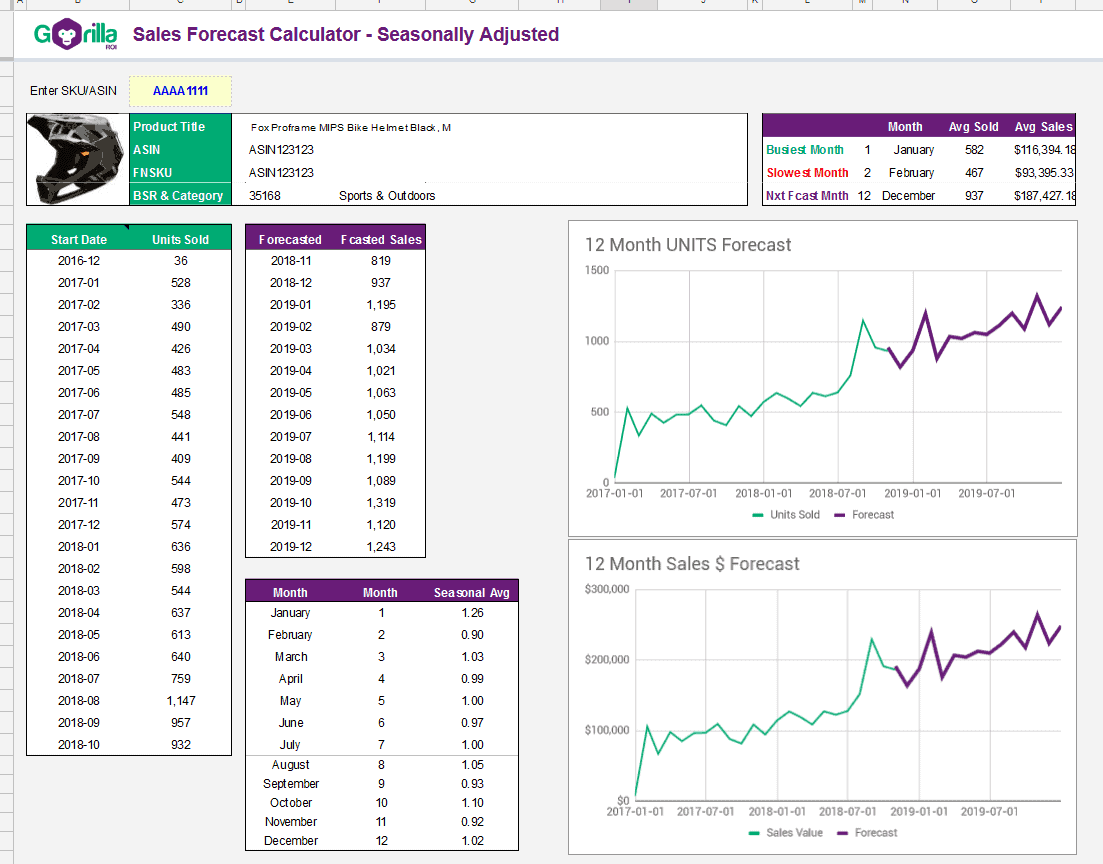
Let’s start with the end product so that you know what you are looking at.
There’s a lot of tutorials on how to seasonally adjust numbers. This is the best youtube video I found on the topic.
Click the image or this link to see the live preview.
With the spreadsheet, it uses the last 23 months of data to analyze. I don’t include the current month as it’s not complete.
So if this is November, I’m going back to Dec 2016 to Oct 2018.
After you do all the math, the main pieces of information you want to see is:
- Actual sales data
- Forecasted data for the next 12 months
- Seasonailty weighting
With this information, you can create the chart you see above.
Green = past actual sales
Purple = forecasted sales
You can see how the connection lines up very well and it’s not simply a straight line going up and to the right.
This way, I can see that a big month is coming in January followed by the Feb dip. And then the next big month is in October of 2019.
Precautions with Forecasting
The biggest problem with any forecast is that no one knows the future.
It’s an educated guess and it simply follows the trend of what happened in the past.
Here’s a few examples of what I mean.
This next example is one of our products that has been losing ground and in a decline.
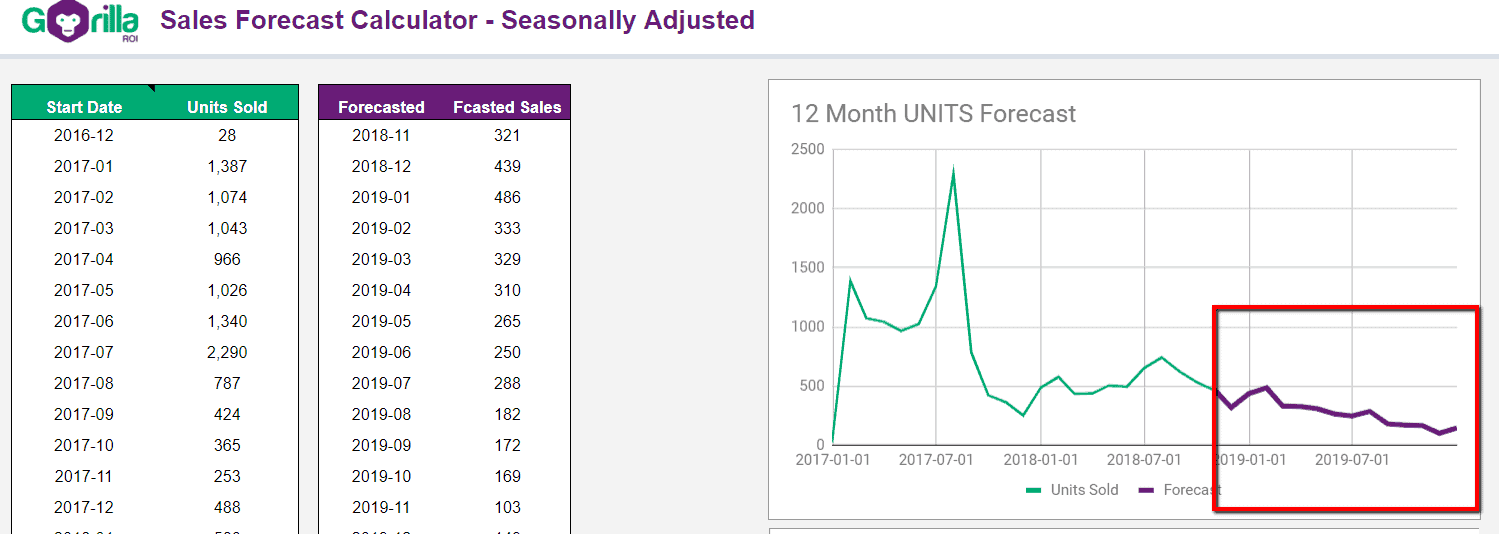
At this rate, it will be dead in 12 months.
So that’s another way to make use of forecasts for products that aren’t doing so well.
If it’s worth the effort, it signals the product needs a jumpstart.
Here’s another one.
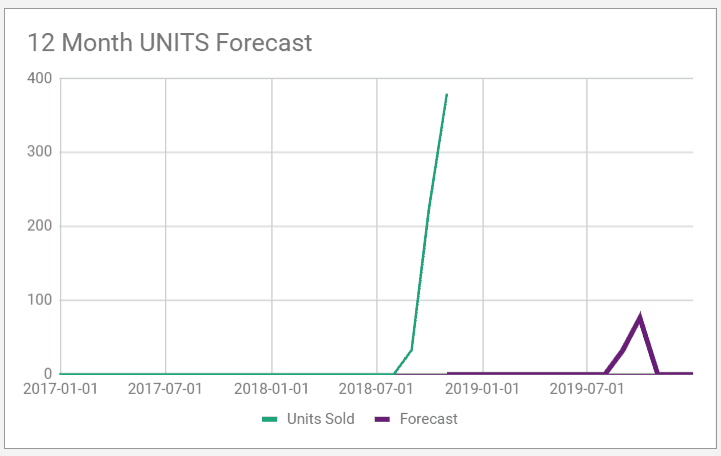
This one is for a new product with 3 months of history.
In such a case, a forecast doesn’t tell you anything.
No Gorilla Sheets Add-On?
No worries.
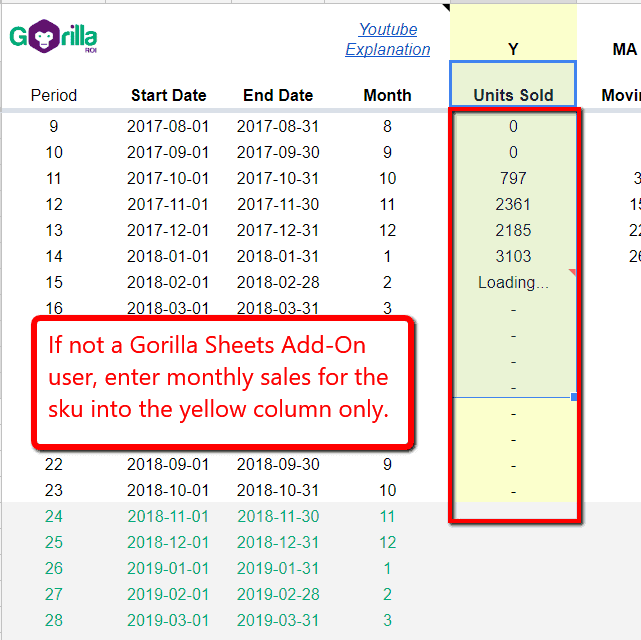
If you purchased the PRO Template package but not subscribed to the add-on, it’s just as easy to manually update the numbers.
Go to your reports and get the SKU you want to analyze.
Get the total units sold by month. And then enter the values into the yellow column only.
All other calculations have been done for you.
Get this Sales Forecast Calculator
If you don’t have the PRO Spreadsheet package, consider getting it before prices go up.
We’ll also be retiring the current special pricing for the add-on, so if you like the way the add-on is making your life easier, you can lock in current discounted rate by going with the annual pricing which saves you an additional 25%.
Comments
Related Posts

Shopify eBay Integration for Busy Sellers: Sell Like Crazy Across 2 Channels
Using an omnichannel sales strategy can help your business reach…

Understanding Shopify COGS: A Comprehensive Guide for Business Owners
Knowing your Cost of Goods Sold, or COGS, is essential…

Boost Sales With Shopify Automation – BONUS: Our 3 Best Shopify Automation Apps
Being an e-commerce company, in particular, means that you have…


Leave a Reply