Article Summary (TL;DR)
✅ Understand the profit per unit sold using the FBA calculator. Utilize strategies to enhance margins and minimize costs. Learn to create a profit and loss statement for comprehensive tracking.
✅ Evaluate seller fees and pricing strategies for profitability. Explore revenue and cost calculations for various marketplaces. Understand the nuances of FBA fees and negotiate with suppliers.
✅ Utilize detailed formulas to analyze expenses and revenues. Optimize pricing and reduce returns to maximize profitability.
Looking to get started with Amazon?
The Amazon FBA calculator is an essential tool for sellers to figure out the profit earned per unit sold. Knowing your profit is vital to surviving and thriving in the cutthroat world of Amazon.
Note: We also have a guide for Amazon storage fees, a break-even calculator, a guide to all seller fees, and our Amazon revenue calculator and forecaster.
There is no need to estimate Amazon FBA fees when you have an accurate (Amazon com FBA calculator) calculator.
There are 2 parts to this FBA calc mega post.
The first part is focused on the Amazon Seller Fees and how to calculate your pricing and think about strategies to improve your margins.
The second part shows you how to create your own profit and loss statement using our automated Google Sheet formulas to track your monthly P&L.
We also have an Amazon revenue calculator (projected revenue calculator) to forecast your business growth and project over 12 months.
By the end of this guide, you’ll know how to:
- Calculate the variable and fixed costs using the FBA fee calculator
- Determine the real profits using different elements (ad revenue?)
- Cut down the overhead costs (ad spend)
- Identify factors that have an effect on the cost of goods sold (COGS)
- Calculate profit and loss in Google Sheets
- Download a free version or get the premium versions too
There are also other calculators like the Amazon book sales calculator. But this article is focused on FBA.
This way, you can determine whether using FBA is profitable for your product and business.
Why should you listen to us?
I have lost so much money with bad quality, shady manufacturers and wasted just as much money on bad agencies and advertising (advertising cost is ridiculous). We’ve taken the school of hard knocks.
Today, we sell over 7 figures with a gross profit of 30-40% blended average. After taxes, our net profit is 10-15% profit.
We are in the trenches running a successful Amazon business. You can read our income reports where we provide a lot of transparency on the wins and fails of our business.
Unlike gurus and promotional YouTubers, we do this as our bread and butter and share what it is truly like.
No Ferraris. No Lamborghini’s.
Just regular folks working hard at creating products, navigating the ever-changing landscape of FBA and making profit.
Our product Gorilla ROI is an fba multi tool that we developed and use in-house. It does many things like calculate sales, sellers rank number, Amazon sales rank, and more.
Part 1: The Amazon FBA profit calculator
Downloads Page: Get the Free Calculator & More Spreadsheets
Here’s some cold hard truth.
Newbie FBA sellers lose money because they don’t use the right numbers to calculate a product’s profit potential and estimated sales.
Every niche is potentially profitable if you know your numbers.
That’s why it’s important to factor in a breakdown of all your costs that include, product COGS, freight, shipping, fulfillment costs, and Amazon seller fees.
I get into how the FBA program compares to Fulfillment By Merchant in terms of the overall fees needed to fuel your e-commerce business.
FBA calculator in Google Sheets
Downloads Page: Get the Free Calculator & More Spreadsheets
Understanding the Amazon FBA calculator
Using the Amazon price calculator, it’s easy to get the associated expenses of existing products selling on Amazon.
The goal of the FBA calculator USA that Amazon provides is to help you decide whether FBA or FBM is cheaper. It’s not to calculate the deep, detailed profit analysis that you may be looking for.
Their focus is to make you see that it’s likely just as cheap to use FBA rather than fulfill products on your own.
I have a calculator for that which is offered in our PRO Amazon Business Spreadsheet package. You may also use an Amazon FBA sales estimator.
There are other risks associated with letting Amazon handle the shipments such as lost inventory, high customer returns, more margin required to offset the fees, increase in PPC costs. But that is a different topic.
PRO TIP: Amazon's goal is to get you selling on their platform.
Amazon FBA revenue and cost calculator for each marketplace
Each marketplace has a different fee due to logistics and currency. $1 USD does not equal 1 EURO.
Note: We have a guide about Amazon revenue calculator & forecaster.
Each marketplace has their own adjusted Amazon revenue calculator. Europe is mostly all going to be the same. New market additions include United Arab Emirates, Netherlands, Singapore and Australia.
- US FBA Calculator
- Canada FBA Calculator
- Mexico FBA Calculator
- UK FBA Calculator
- France FBA Calculator
- India FBA Calculator (Amazon FBA fees India)
- Italy FBA Calculator
- Germany FBA Calculator (Amazon FBA Kosten Rechner)
- Spain FBA Calculator
- Netherlands FBA calculator
- FBA Amazon Calculator UAE
- Australia FBA calculator
If you sell on multiple marketplaces, use the correct calculator to adjust your pricing accordingly.
PRO TIP: Selling in another country's marketplace is always more expensive than your home country cost. Adjust pricing to match the increase in cost.
How does the Amazon Fee Calculator work?
There are lots of Amazon fulfillment fees that get confusing – especially for new sellers.
Using the FBA fee calculator, you can identify the following expenses for any products when you load the ASIN into Amazon’s calculator.
- Removal order fees
- Returns processing fees
- Inventory storage fees (Amazon storage fees & calculations)
- Long-term storage fees
- Pick and pack fees (now all included as FBA fulfillment fee)
- Inbound shipping (using Amazon’s partner carrier shipping cost to send inventory to warehouses)
- Referral fees (AKA closing fees)
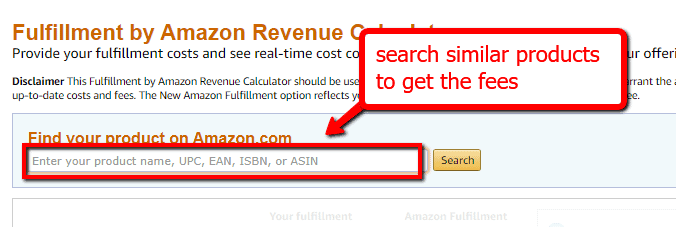
Open up the correct marketplace calculator for where you are selling and enter the product title, UPC, EAN, ISBN or ASIN.
If you are currently not selling, use a competitor’s product to get the fees and details.
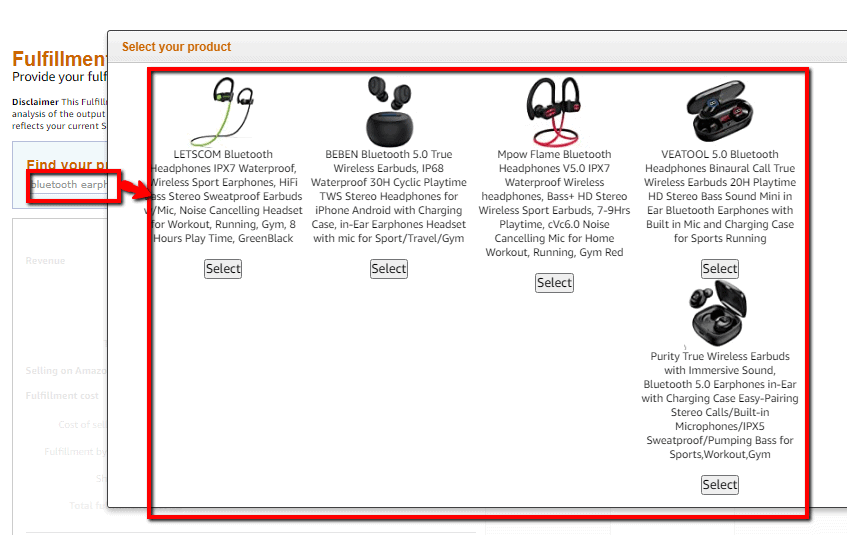
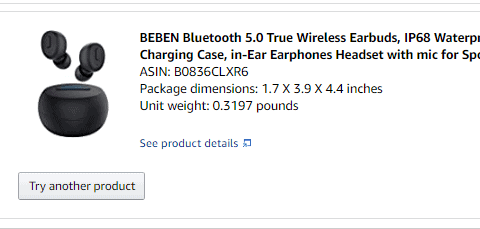
In this example, I entered “bluetooth earphones” and some recommendations show up.
Select a product to use in the calculator and product details show up.
You can see the ASIN, package dimensions, and the weight.
Amazon FBA fees are based on dimensions and weight. That’s how they calculate their fees.
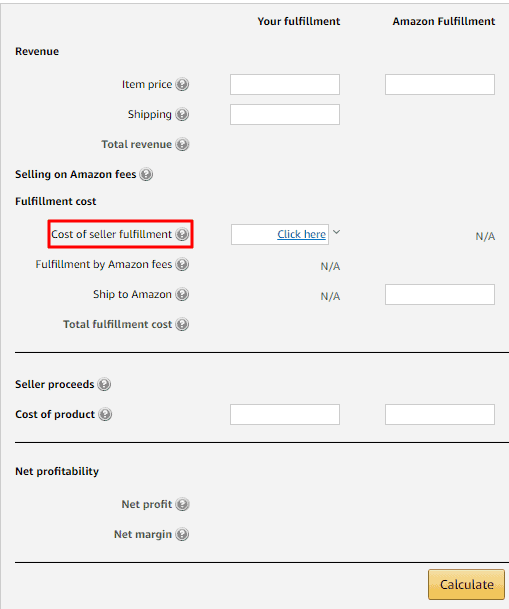
The main calculator is now activated and looks like this.
This is where you enter your costs for when you ship via your own online store and another one for when you ship using FBA.
Clicking on “cost of seller fulfillment” will open up another small box where you can enter numbers of more detail like how much you currently pay for:
- monthly storage (we also have a way to calculate storage fees)
- labor
- packaging material
- shipping to customer
- customer service
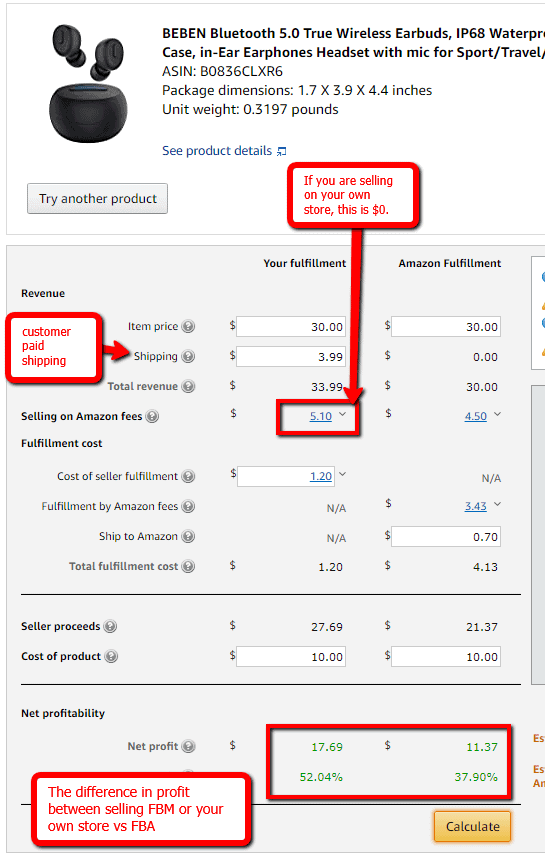
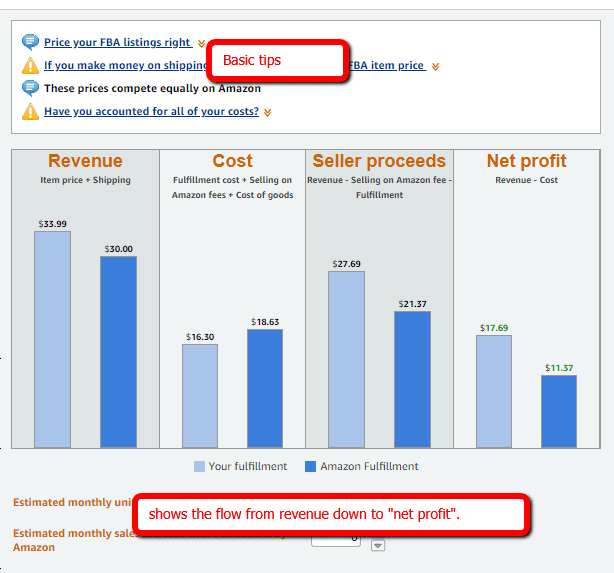
The dashboard uses simple form fields to give you a complete report of all the costs which include the selling fees, FBA fees, and estimated net profit.
Let’s see how it compares with the following inputs.
Remember Amazon’s goal. It is for you to sell using FBA.
But if your product pricing is good, FBM or selling on your own site is always more profitable if you have good traffic.
FBA is very powerful because of the traffic with very little effort.
PRO TIP: "Net profit" on the calculator is not the actual profit margin. It does not consider other operational expenses such as advertising, returns, insurance, etc.
Unlike typical calculators, this FBA-optimized tool will help you see your numbers on a cost-per-unit basis. This is the best way to calculate profit rather than using absolute sums.
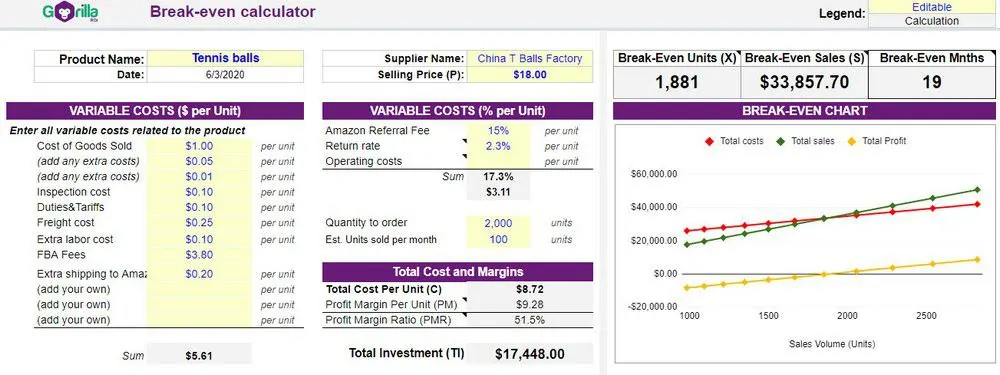
It’s why our Break-even calculator works much better because it’s focused on a per-unit basis. Check that calculator here. We also have many Amazon seller resources here.
You don’t need real numbers. You can use estimates and get worthwhile results that give a rough blueprint of the total fulfillment cost per unit sold.
What are FBA selling fees?
The main FBA fees you’ll be dealing with.
- Removal order fees
- Returns processing fees
- Inventory storage fees
- Long-term storage fees
- Pick and pack fees (now all included as Fulfillment Fees)
- Inbound shipping (using Amazon’s partner carrier to send inventory to warehouses)
- Referral fees (AKA closing fees)
We already have a monster guide on all the Amazon seller fees and what they are. There’s also a free spreadsheet in that article. We use our own tools for the most part, even on our income reports.
But let’s tie it in with the Amazon FBA calculator.
FBA fees are the associated expenses that the seller incurs when the buyer makes a purchase on Amazon.
These fees apply to all sellers, regardless of whether you use FBA or FBM to deliver orders to the customer.
The FBA fees vary depending on the kind of service subscription a seller prefers to work with. Amazon merchants can choose a Professional or Individual plan.
For sellers who fulfill 40 units or less, the Individual account works just fine. While it doesn’t come with any monthly commitments, you’ll pay about $0.99 for any item you fulfill using the FBA program.
If you upgrade to the Professional plan, the monthly subscription fee is $40.
PRO TIP: Don't waste your energy nickel and diming. $40 is not a lot to get started. Think of it as a cost of doing business and to unlock all the features. You will never do 7 figures in sales by trying to save a few cents here and there.
In contrast to the Individual plan, your sales volume isn’t limited, and even better, you don’t pay any fees for each item a customer adds to the cart.
If you don’t believe you can sell 40 units a month, it is not even worth doing Amazon FBA as you will pay all sorts of other fees and it is more expensive overall. Better to test your product and idea on eBay.
Both Professional and Individual sellers also need to factor in the referral fees, which range from 6% to 15% and fluctuate based on the item category.
Unlike other expenses, referral fees are like a commission paid to Amazon only after the sale of a product is made. Amazon gets a cut for you to use their platform.
To figure out the actual profit, remember to check any “hidden costs”. We’ll look at all these fees in a moment. This is easier to figure out if you use the Amazon FBA calculator.
The FBA cost you must understand
Other than the Seller account fees, the FBA profit calculator lets you take into account all the associated fulfillment expenses.
Fulfillment fees depend on whether you want to use Fulfillment by Amazon or handle the logistics yourself.
If you have any stale inventory sitting at Amazon’s warehouse, you will need to pay the inventory removal fee to get rid of the unsold stock. This costs anything between 50 to 60 cents per unit. You can dispose of it, but what Amazon does is sell it off in bulk at 1-10c per unit.
Here’s an example of someone who purchased supposedly “disposed” items at discount.
Such an expense may seem trivial but starts to eat up margin if you have to recall massive amounts of inventory.
FBA covers things like warehousing, shelving, packing, shipping, customer support. It makes it very easy to run and scale because all the components are offered by Amazon.
You can have the product shipped from China directly to Amazon so that you don’t even have to touch the product.
For returns processing, the FBA price calculator allows you to get the exact cost per unit, which starts at $2.50 to over $100, depending on the size and weight of the shipment.
It all comes down to reducing your FBA fees because the lower it is, the higher your margin.
This could be packing your product so that it is as thin as possible to get in the cheapest rate of $2.50.
Or if you sell a long item, see how you can reduce the length down. By being creative with how the product is packed, you can bring down your fees and fatten your margins tremendously.
Don’t forget about indirect and variable costs that affect profitability
There are indirect costs that pile up and flatten your profit margin curve. Things like insurance, the cost to ship product samples, bookkeeping, warehouse rent, and so forth.
Let’s say your gross profit is 40%, but if your costs are so high that the cost of doing business equates to 30%, you end up with 10% net profit. Not so great.
This is why you need a finer breakdown of expenses to track your profitability.
Some categories of expenses you should consider:
- COGS: product cost, freight, shipping to amazon, software
- Operating expenses: PPC advertising (PPC campaigns), rent, labor, auto, insurance
- Misc: taxes, travel
To get more granular, this is where our Gorilla ROI break-even calculator comes in.
A better Amazon FBA profit calculator – our break-even calculator
The first video at the top of the article is for a basic Amazon FBA fee calculator.
This one calculates your profit with more business inputs.
This Amazon calculator is a spreadsheet template included in our Business PRO spreadsheet package.
A full instructional guide on how to use this break-even analysis is here.
A break-even point is simply the point at which your sales equals the total expenses of the product after including all fixed and variable costs.
All the expenses mentioned above can be broken down to a per unit basis.
- COGS: product cost, freight, shipping to amazon, software
- Operating expenses: PPC advertising, rent, labor, auto, insurance
- Misc: taxes, travel
For an Amazon fee calculator to truly show you profitability, it must account for all these factors.
If you can sell more than your business expenses, it is profitable.
If not, you lose money for every unit sold.
Using this calculator, you can accurately divide the number of fixed costs( seller fees), with the revenue per unit minus the variable operating expenses(think shipping costs).
The major problem with free break-even calculators on the internet is that it does not go beyond the bare basics. It assumes the production costs are always constant.
This calculator is not only limited to Amazon sellers. It uses a flexible formula that fits merchants selling digital products and e-commerce retailers on other marketplaces such as Etsy, Walmart, or eBay. Just update the names of the expenses.
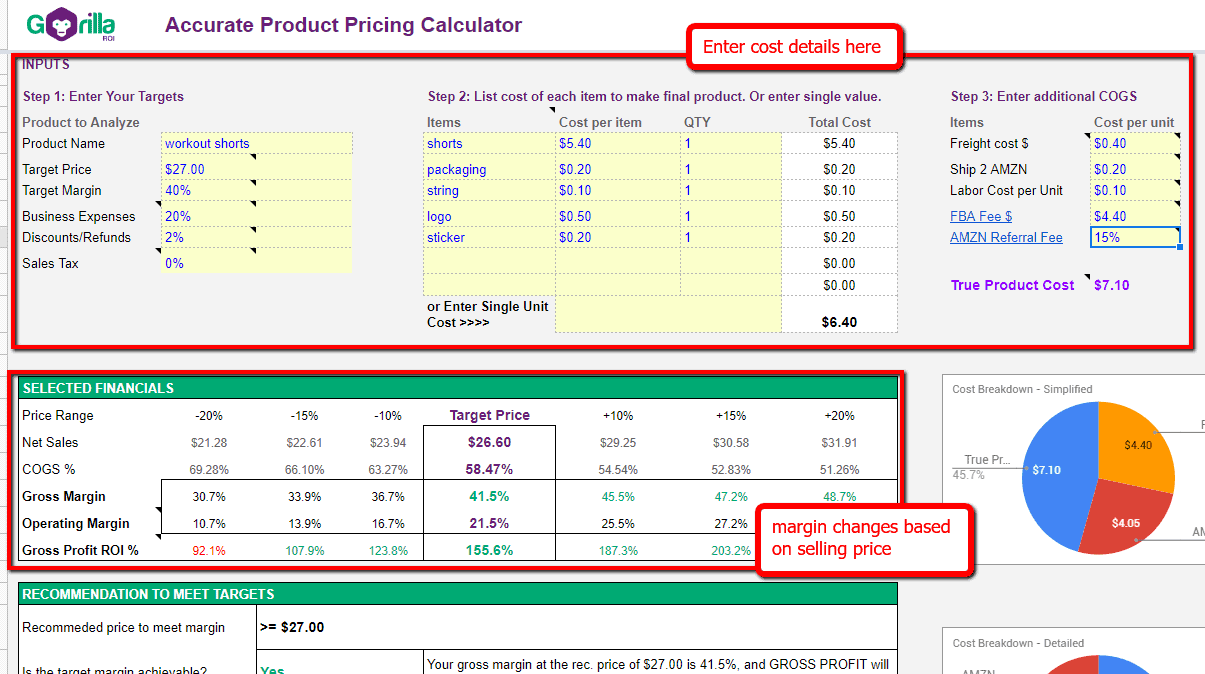
Gorilla ROI Accurate Product Pricing Calculator (premium)
Before trying to figure out what price you should sell a product, the best method is to understand what margin you want.
Costco and Walmart work with 1-2% net margin (after taxes and interest).
Other businesses have net margins as high as 15-20%.
For more volume, lower your margins. For more profitability, increase your margins.
PRO TIP: Use a benchmark margin for your business. Don't randomly assign margin requirements.
If your selling price does not cover the fixed and variable costs, don’t expect to rake in any profits.
Every Amazon seller needs to learn how to price products for profit and exponential growth.
With the product pricing calculator, you can crush your competitors by knowing what is the min and max price you should sell a product.
For example, our company runs on a target gross margin of 40% and 15% operating margins. We enter all of our fixed and variable costs and desired selling price.
The product pricing tool auto-generates a consolidated profit & loss statement which indicates if the target price is really profitable. The cool part is our sensitivity matrix which shows the change in profitability as the selling price decreases or increases.
Based on my costs and inputs, it’s telling me that I need to sell between $23.94 and $26.60 to achieve my margin requirements.
If the price is too high, every seller and their mother will want a piece of the action. If I need to liquidate it, I can go down to $20 and still be profitable.
Strategies for FBA sellers to maximize profit margins
Know your costs
Identify all hidden costs. It’s as easy as going through your transaction reports and jotting down all the stuff Amazon takes from you. Then include it as a per-unit cost. This way, you’ll be able to maximize your ROI.
We take it as granular as the poly bags that are used for shipping. It’s $0.01-$0.025 only, but when shipping out 100k units, it starts to add on.
Where most people have trouble is calculating their operational expenses.
Instead of summing up the total lease, electricity, water, trash, internet etc. The best and easiest way is to open up last year’s P&L and look up the number for “total operating expenses”.
Then divide the number from total sales.
Total Sales ÷ Total Operating expenses = Operating Expense %
If you end up with something like 20%, it means that 20% of your sales go towards operating expenses.
Easy.
Reduce returns
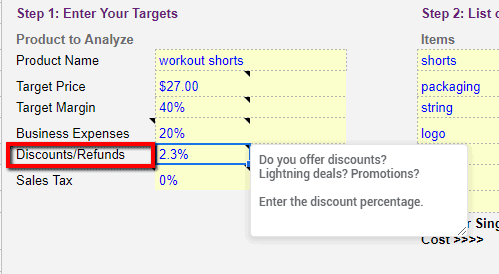
We track returns as a percentage and think of them as discounts. It’s the cost of doing business, but the more you can reduce it, the better.
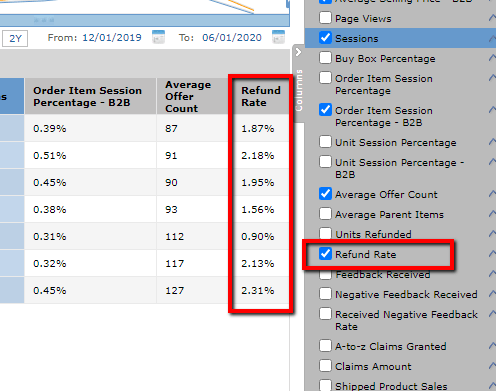
On Amazon, we average 2.3% in returns, which you can see from your business reports.
On our Amazon pricing calculator, the refund rate is taken off the total sales, much like a discount.
If our refund rate is 5% and the selling price is $100, we assume net sales of $95. Not $100.
However, if you can’t anticipate and control returns, you will leak profit. This should be accounted for when you calculate your costs and added back into pricing.
Here are some simple ways to reduce return rates and maximize returns.
- Use detailed and correct product descriptions. The item which you ship to the buyer must have specifications that match the description on the product page. You can also include more context on how to resolve a claim where the product is faulty.
- If you’re sourcing products from a supplier, negotiate a discount or partial refund anytime they ship a damaged product to your potential buyer.
- Make adjustments to your order handling if there is an increase in return requests, damaged goods or chargeback claims.
- Use high-resolution images to give the buyer the perfect idea of what features your product is made of. Clearly describe the current condition(new, used).
- Use short videos. Phones can create great product videos. Keep it simple.
Negotiate with your suppliers
This is a no-brainer but had to include it.
The better your pricing is, the better your margins.
But be careful. Many suppliers will agree to your lowered pricing without objection because they lower the quality accordingly to make their own profit.
PRO TIP: always focus on win-win pricing. Don't bully suppliers as you will shoot yourself in the foot once you receive the product.
There are many areas where you can negotiate better rates or use creative negotiations. Ask for discounts at different quantities, meeting performance, after a certain time, etc.
This applies to freight forwarders. Find a win-win relationship and your fees go down, profits go up.
While making negotiations, it’s more practical to show interest that you’re looking for a long-term business relationship. From this perspective, it would be much easier to secure a better deal from your supplier.
Part 2: Track using an Amazon profit loss spreadsheet
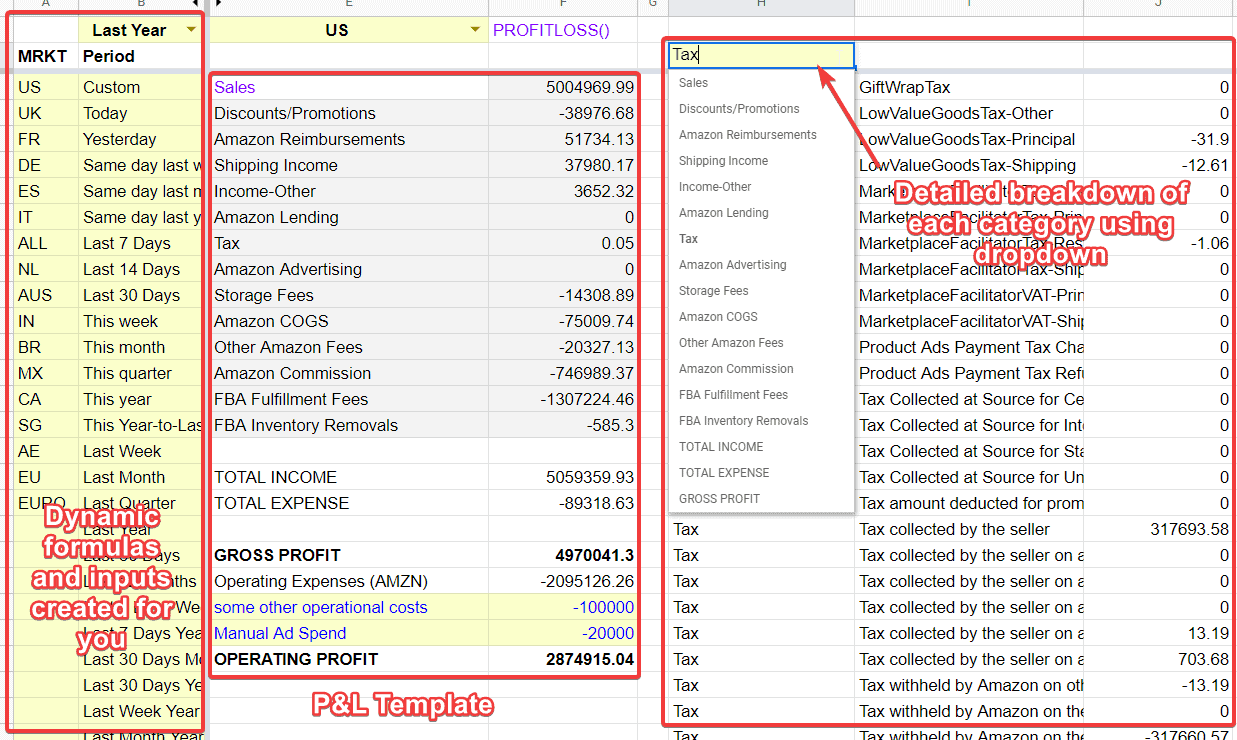
This next section is to show you have to create a FBA P&L template. There is a link to this profit and loss spreadsheet I’ll be sharing below. This is what it looks like.
All the content above shows you how to think through the fees so you can profit from your venture.
But if you can’t track it throughout the entire business and track your P&L, there’s no point in running a business.
If you don’t know your P&L numbers, you are not running your business. The business is running you.
Now let’s move on to creating your own P&L statement in Google Sheets. With our Amazon to Google Sheets integration, you can automatically generate a profit loss table which you can use to analyze your Amazon profit margins over different time periods.
If you don’t have our Gorilla ROI addon installed, do so first and follow the install instructions if you want to automate and speed up the tedious process.
If you are an advanced user, you can go straight to the Profit Loss documentation page which includes example formulas, and a video guide.
As always, we update documentation consistently and in multiple locations to make it easy to find.
- Official page of all the functions we support
- Website documentation for easier navigation
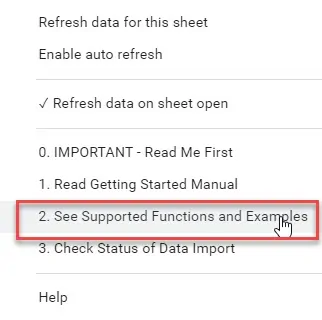
- On any Google sheet > menu > addons > Gorilla > 2.See Supported Functions and examples
How to pull data to create an Amazon Profit Loss statement
Formulas to pull and create your Amazon profit calculator or spreadsheet
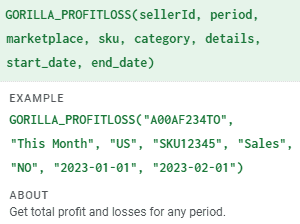
Before getting into the details of the Amazon profit calculator in the next section, you need to know how to get the data.
The quickest and easiest way to get started once your data is synced and ready is to type it into any blank spreadsheet
=GORILLA_PROFITLOSS("TESTSELLER", "this year")
This one formula entered into cell A1 will automatically generate a consolidated table like the following:
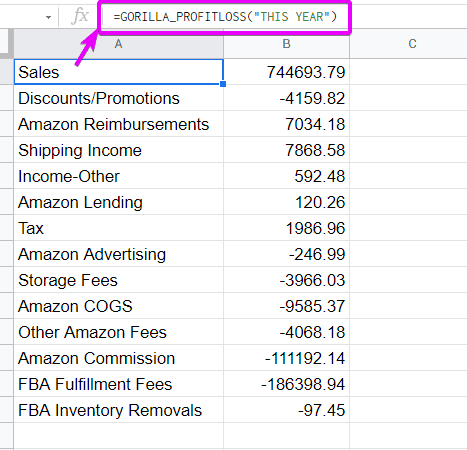
Rather than going through every transaction in the settlement report and then categorizing and reconciling it yourself manually, it is done automatically. To change a time period, change it from “this year” like the formula above to something else like “last 30 days”.
Use any of these date periods that we support.
- Today
- Yesterday
- Same day last week
- Same day last month
- Same day last year
- Last 7 Days
- Last 14 Days
- Last 30 Days
- This week
- This month
- This quarter
- This year
- This Year-to-Last-Month
- Last Week
- Last Month
- Last Quarter
- Last Year
- Last 60 Days
- YYYY
- Last 12 Months
- Last 7 Days Week Ago
- Last 7 Days Year Ago
- Last 30 Days Month Ago
- Last 30 Days Year Ago
- Last Week Year Ago
- Last Month Year Ago
- YYYY-MM (change format to text)
- YYYYQ1… YYYYQ4
More examples
=GORILLA_PROFITLOSS("TESTSELLER", "LAST 30 DAYS")

=GORILLA_PROFITLOSS("TESTSELLER", "2021-01")

=GORILLA_PROFITLOSS("TESTSELLER", "2021Q4")

=GORILLA_PROFITLOSS("TESTSELLER", "THIS MONTH") and more
More Profit Loss Examples
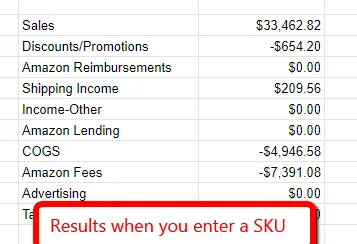
You can also build a profit and loss statement per SKU.
=GORILLA_PROFITLOSS("TESTSELLER", "THIS YEAR", "US", "SKUNAME721")
When you define a SKU, the profit loss table will not include Amazon Reimbursements, Income-Other and Amazon lending.
This is because certain transactions are NOT applicable to a sku. The transaction is matched to your seller account, not SKU.
Think about storage costs. If you look at your transaction data, storage costs are always associated with your seller account.
Amazon does not charge you per SKU. It is a single dollar amount each month.
You can also see the details of what is rolled up into each of the categories.
- Sales
- Discounts/Promotions
- Amazon Reimbursements
- Shipping Income
- Income-Other
- Amazon Lending
- Tax
- Amazon Advertising
- Storage Fees
- Amazon COGS
- Other Amazon Fees
- Amazon Commission
- FBA Fulfillment Fees
- FBA Inventory Removals
To look up a category, use a detailed formula like:
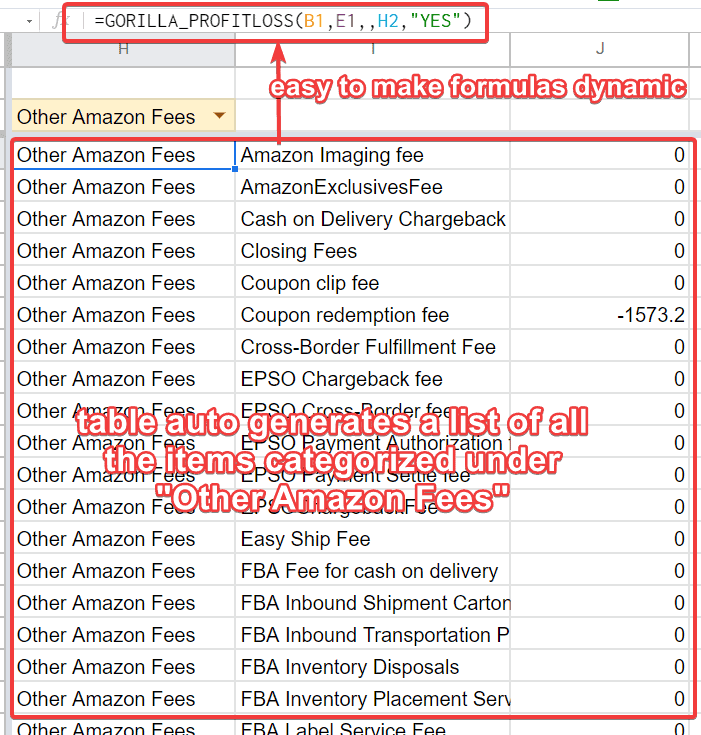
=GORILLA_PROFITLOSS("TESTSELLER", "LAST 30 DAYS", "US", ,"OTHER AMAZON FEES", "YES")
By entering “OTHER AMAZON FEES” and “YES” at the end, it will list all the Amazon seller fees one by one and the amount transacted for each item.
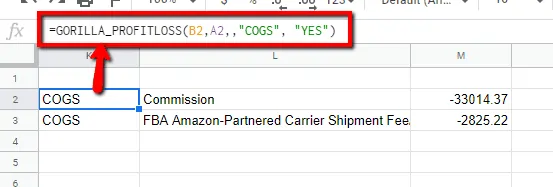
=GORILLA_PROFITLOSS("TESTSELLER", "THIS YEAR", "US", ,"COGS", "YES")
Same thing here where I can drill down on what is rolled up into “COGS” by looking it up in the formula.
Creating your Amazon Profit Loss Spreadsheet
Here’s the spreadsheet again. There are 3 main parts.
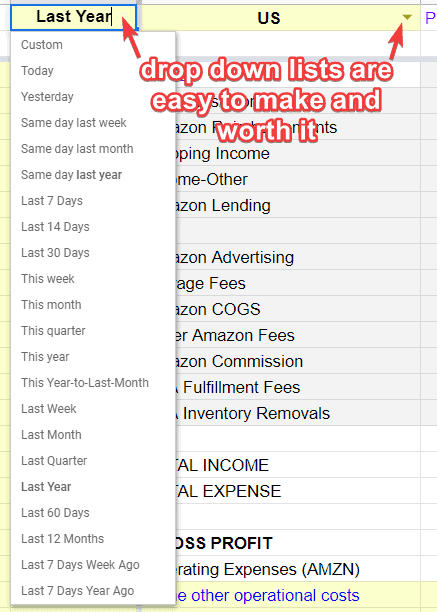
- Dynamic inputs using dropdown menus for you to switch time periods, marketplaces, SKU etc
- The main P&L section
- An exploded view of what is rolled up into each category
The formulas to create sections 2 and 3 were already provided above.
=GORILLA_PROFITLOSS("TESTSELLER", B1)
where B1 is the dropdown list cell where you can select the different time periods.
And the detailed view of the category is created using the syntax of the following formula, but changed to use dynamic cell references instead of manually entering the values into the formula.
=GORILLA_PROFITLOSS("TESTSELLER", "THIS YEAR", "US", ,"TAX", "YES")
Final thoughts: is the Amazon FBA calculator worth using?
It’s free. So yes.
The best use of the Amazon FBA calculator is to find the fees that a competitor is paying.
You then feed this info into our breakeven calculator or Accurate Product Pricing calculator to get the best details and analysis.
A lot is missing on Amazon’s calculator (like book sales, best seller rank, sellers rank/seller rank, and sales rank), but it’s a good start. The only problem is that you could end up with a false picture. Thinking it is more profitable than it really is.
Make the best use of the FBA profit calculator and the above-listed spreadsheet templates to streamline your margin projections and cut unnecessary costs that downsize the potential ROI.
Download our FREE Amazon FBA calculator
Downloads Page: Get the Free Calculator & More Spreadsheets
Comments
2 responses to “Free Amazon FBA Calculator and Profit Loss Spreadsheet”
-
Thanks for the great posting. I have been used a few different paid apps to calculate Amazon profit and margin my selling, unfortunately, they are not corresponding per shipment and currency exchange rate at the time of receiving payment from Amazon. This is where all oversea sellers got confusing their calculation. Does your calculation has options for currecy rate and each shipment cost for the same SKU?
-
It’s possible because it’s a spreadsheet so it can be 100% edited and customised.
But trying to match exchanges rate is hard to keep track of properly and you are way overcomplicating it unless you are trying to do an audit of your finances.
1. you would need to keep a history of the exchange rate for each payment
2. every time a payment is received, you have to redo ALL the calculations based on the exchange rate
3. if you try to adjust shipment cost of each sku, you must have a very good bookkeeper and accountant who can match your FIFO or LIFO accounting methodThis is why overseas sellers get confused because it doesn’t have to be this complicated to sell a product.
We sold in the UK and the important thing is to calculate based on your percentages and margins.
There’s a reason why big sellers, massive corporations, investors, VC’s think in terms of margins and can do quick math in their heads – and be profitable.
-
Related Posts
Mastering Shopify’s UTMs: The Simple Way to Smarter Marketing
Let’s be honest: marketing your Shopify store without tracking what’s…

10 Profitable Product Categories for Amazon Affiliates 2025
What you’ll learn Amazon is a favorite for experienced and…

Unlock the Secret to a Profitable Automated Amazon Store: How to Build a Hands-Free Income Stream
Ever dreamed of running a profitable Amazon business while sipping…



Leave a Reply