.svg "Gorilla ROI")

Article Summary
✅ Explore the performance metrics and milestones achieved this month for our FBA business, reaching $192K in sales.
✅ Learn about the strategies implemented to drive sales growth, including inventory management, pricing optimization, and marketing efforts.
✅ Gain insights into the challenges faced and lessons learned during the month, highlighting opportunities for improvement and future growth.
Upfront disclosure.
The numbers and information I share in these monthly updates are selective and for educational purposes as there are people I know personally who reads this. Also need to keep trade secrets and sensitive information under wraps of course.
The purpose of starting this monthly review is to organize my thoughts on the Amazon FBA side of things and reflect on the past month.
We'll see how these posts evolve based on how you find it, and what information is helpful or not.
May FBA results

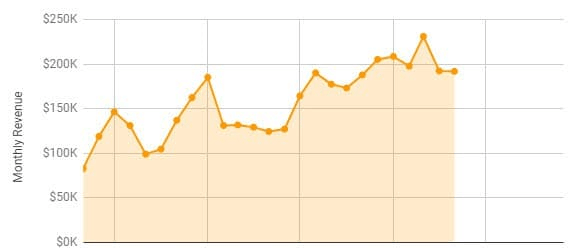
Sales is slowing down for the summer months. We don't sell seasonal products, but when the sun comes out, people tend to go out and delay their purchases.
You can see it from the chart above as well. Last year, we were flat from Feb to June.
This year is an improvement though.
Our slow month kicked in starting the previous month this year. Our best month ever was March, which was a major surprise.
For the month of May, FBA revenue was flat coming in at $192k. Same as the previous month.
If we can keep things steady for the next couple of months, instead of experiencing any big drops during the summer months, that's a win for us. With some major expenses coming up, I'll need all the cash coming in.
Summer slow downs have a positive aspect though. It's a great time to improve our operations like:
- Plan and develop future products
- Update processes
- Re-train staff
- Upgrade assets
- And improve other areas we can identify
Once July comes around and sales picks up again, the goal is to be prepped with inventory ready to go and have the improved processes implemented and ready to go.
Our office relocation in September isn't going to make things easier. More furniture, more office updates and more improvements are going to be needed.
If it was still me, I'd be working out of a cardboard box, but with a team to take care of and making sure each person operates effectively, efficiently and safely, I don't skimp on expenses required for such operations.
Also, getting enough product ready so that we can have a full 1-2 week blackout period is going to be crucial.
Area of Weakness (YTD)

One aspect of the business lacking is our product development and getting new products into the pipeline.
The pipeline is thin at the moment as some projects just continue to get delayed again and again. Other projects were also pushed back for a later date as we try and make smarter product development decisions.
There are products that I thought would be super easy to make and push to market. My initial goal was to get it finished and launched within 2 months.
- Found a supplier
- Made sure they were legit
- Specs delivered and confirmed
- Samples received
- Samples failed testing
- More back and forth to clearly define requirements
- New samples received
- New samples failed testing
Since we do OEM stuff and never rely on reselling existing products, the process takes longer. In this new case, I find out after testing that the supplier is trying to use cheaper raw materials in order to maximize their own margins.
Usual sneaky stuff. Rightfully called - quality fade.
If this is something you want to know more about, you have to read Poorly Made in China. One of the best books that I've come across on doing business in China.

Thankfully, I do have some new products arriving this month. We've created different variations of a good selling product to expand our reach on Amazon.
Also makes it easier if we can reuse raw materials to achieve scale and lower cost - every penny counts.
Now, let's get into the numbers.
Margins for This Month

Last month, I mentioned that our gross was 45% and not to get excited because it's just a single month.
Not to be expected as the norm.
May proved that case to be true. Our gross was just under 38%. I haven't finished cleaning up the numbers, but it's close.
38% gross is just ok.
Not great. But again, the same argument holds. It's just one month.
I was looking up the financials for Proctor and Gamble which is a great template for us to follow. I try to model our company performance based on Proctor & Gamble as well as Helen of Troy.
Check out the financials for PG though.
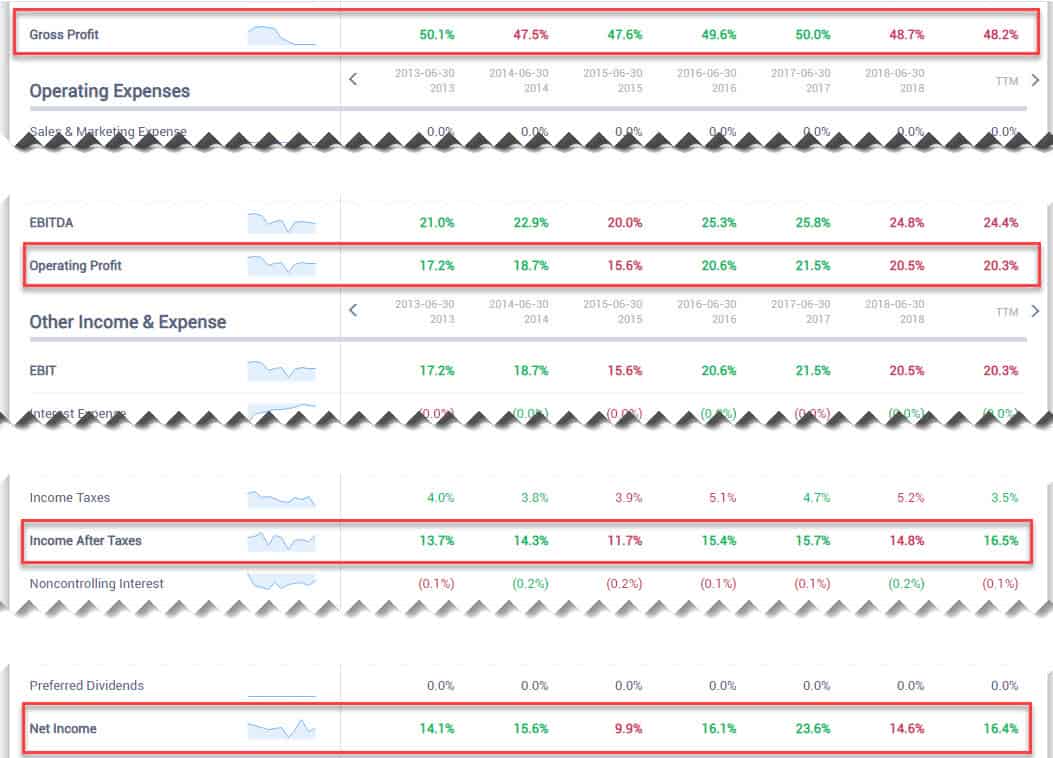
To make it easy, I highlighted 4 main line items.
- Gross profit of 50%
- Operating profit of 20%
- Income after taxes around 15%
- Net income around 15%
Knowing these types of numbers and having a model company to base your company and where you want to be is very important.
Your strategy is going to determine your margins.
Are you operating a dollar store concept? Reality is your margins will be lower with more volume. Think 3-4% operating margins.
Are you more of a reseller? Then follow the footprint of Target's margins.
- Gross margin of 30%
- Operating profit of 5-6%
- Net profit of 4%
You can't expect to get 40-50% gross margins when you run a Target business model.
For us as OEM sellers and brand builders, we work towards the 40-50% gross range.
The hardest part?
The discipline and objective decisions required to execute on those margins every quarter.
Biggest Expense Item

- Amazon fees eat up 40% of expenses.
- PPC came in at 12% of revenue. Ugh.
- COGS is what it is.
- Payroll - nothing I can do
These make up the bulk of the expenses, but as you know, there's no way around any of these.
The best option is to increase ROI on the PPC ad spend. Our account ACoS for the month was 28.4% which has improved from 31%. I truly need to get it down to 25% in order to stay inside the allocated budget.
Staying at around 25% ACoS means that PPC will be 10% of total revenue. If we go above 10%, then that spells trouble. Last month, it was 12% because we are still optimizing as well as experimenting with some new PPC strategies.
Exploring new ideas in PPC always equates to higher spending and pain in the short term.
I'm also starting to get into Facebook ads to drive external traffic. ACoS needs to be optimized and improved further so that there is more buffer to explore and experiment with other platforms.
Wholesale and Our Online Store
I'm not including our direct or wholesale sales in these numbers as Amazon makes up the majority percentage.
Free Spreadsheets for All
The free FBA spreadsheet resource page is now up and available to download for free.
These are spreadsheets I've been sharing via email but now you can download it immediately without having to sign up for anything.
Just copy straight to your account.
Some are simple, manually updating spreadsheets that analyze your data. Others can be used with the free addon from the Chrome store to auto load your Amazon data into Google Sheets
You can use it for free for any 3 FBA SKU's. FBM isn't supported.
Bookmark, share and download it as I'll be updating the page with more free spreadsheets to make it a destination for your one stop free FBA templates resource page.
Gorilla ROI Now Saves Historical Inventory Levels
You can now extract your historical inventory data by dates and using the preset time periods we offer. The purpose of this function is to know when you went out of stock.
When you are planning and forecasting for inventory purchase, you can exclude the days you were out of stock from the equation for a more accurate picture.
Documentation and the functions page will be updated soon.
Here's how it works if you happened to come across it while working with your spreadsheets.
It works exactly like GORILLA_SALESCOUNT() and SALESTOTAL()
=GORILLA_INVENTORYHIST(period,sku,marketplace,status,start_date,end_date)
=GORILLA_INVENTORYHIST("Custom","US",A1:A500,"INSTOCK", "2018-01-01", "2019-01-31")
This example will dump your historical "instock" levels from Jan 1 to Jan 31.
For Agency users, the formula includes the seller ID as the first variable.
GORILLA_INVENTORYHIST(sellerId,period,sku,marketplace,status,start_date,end_date)
This ends this month's update.
Come back for next month's figures as it will be the halfway point of the year and I'll have a better picture of our progress as we work towards our mid term goal of $5M in revenue.


.webp)
