Article Summary (TL;DR)
✅ Learn how to create custom dashboards for FBA sellers within Google Sheets, offering various tools like sales tracking, inventory management, fee and profit calculators, and more.
✅ Utilize Gorilla ROI’s addon to seamlessly import Seller Central data into Google Sheets, eliminating the need for manual data entry and streamlining the dashboard creation process.
✅ Follow step-by-step instructions to build dynamic dashboards using advanced spreadsheet formulas like VLOOKUP, QUERY, and IMPORTRANGE, focusing on simplicity, automation, and effective visualization techniques.
This article is for people wanting to create a flexible and custom Amazon seller dashboard within Google Sheets.
It is NOT for people learning how to navigate Seller Central and understanding how the widgets work.

Looking for flexible and custom FBA seller dashboards?
We have a lot of free dashboards for FBA sellers on this website.
Downloads Page: FREE Amazon Seller Dashboards and More Spreadsheets
It’s possible with Google sheets because of the flexibility and no code environment.
If you have the data inside your spreadsheet, you can create unique dashboards that fit your business needs rather than being stuck with software that is not flexible enough to meet your needs.
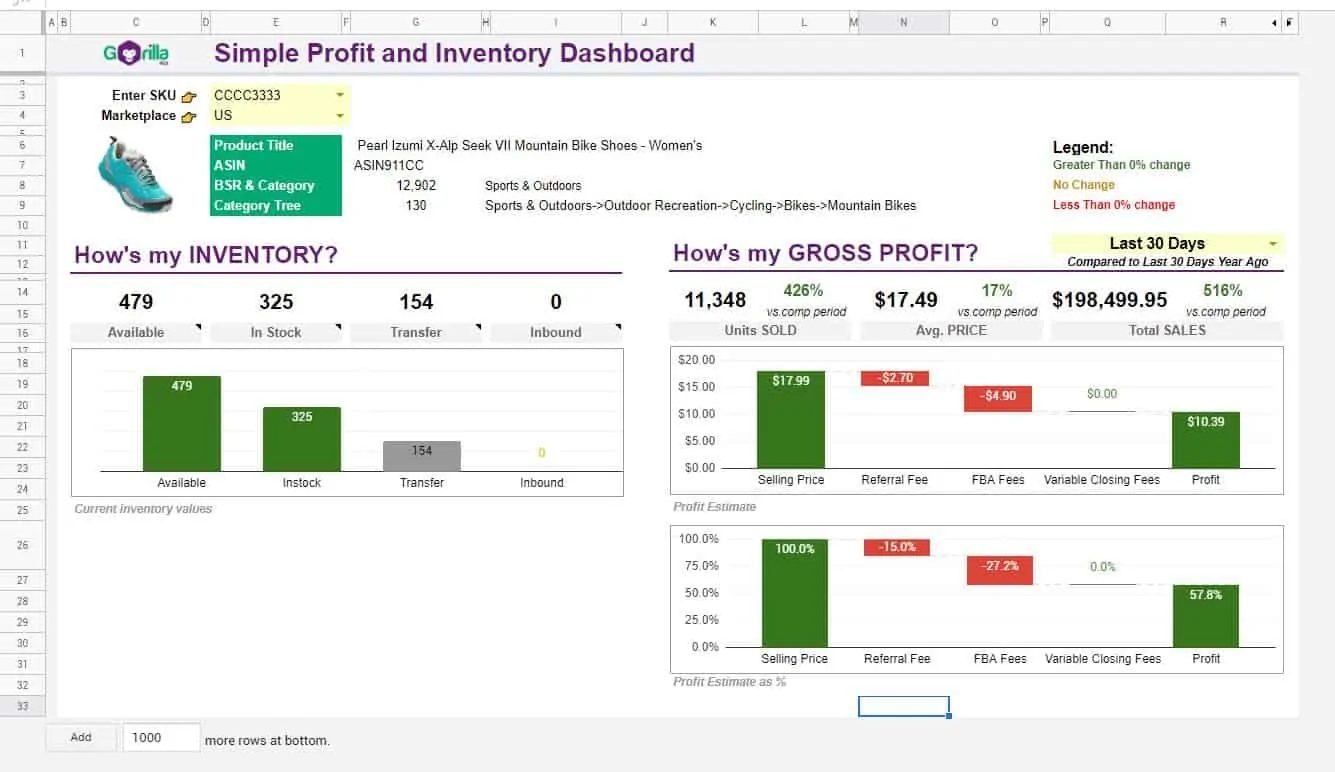
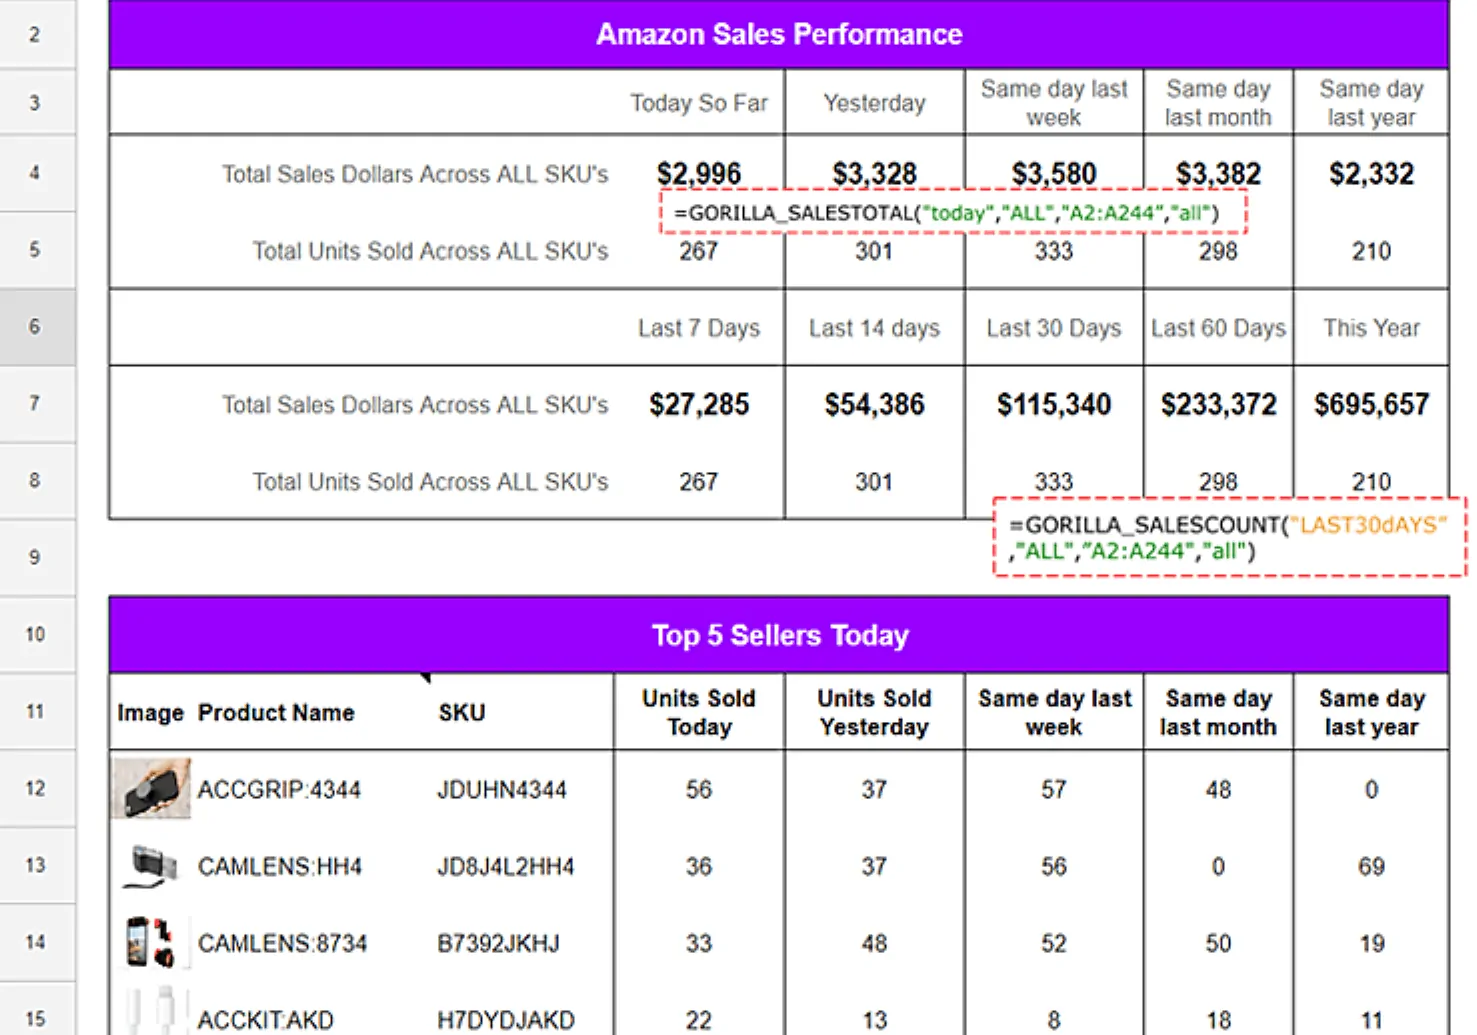
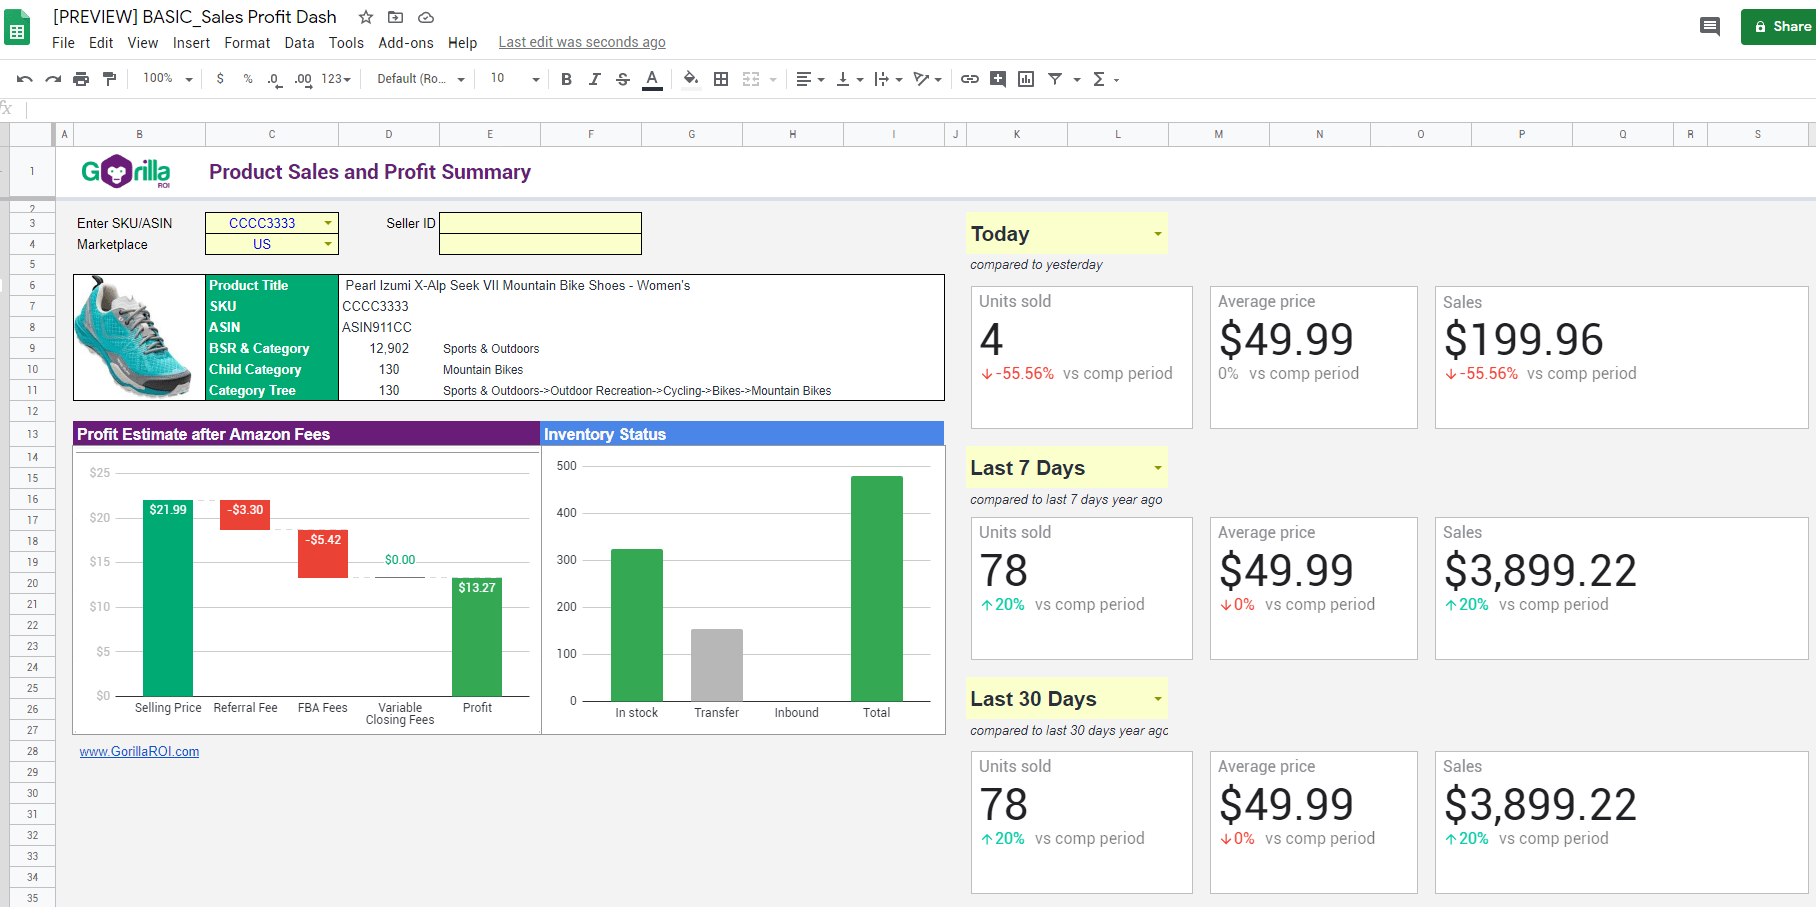
Here are a handful of dashboard examples that you can copy to your Google account.
FBA Profit and Inventory Dashboard
Amazon Sales Performance Dashboard
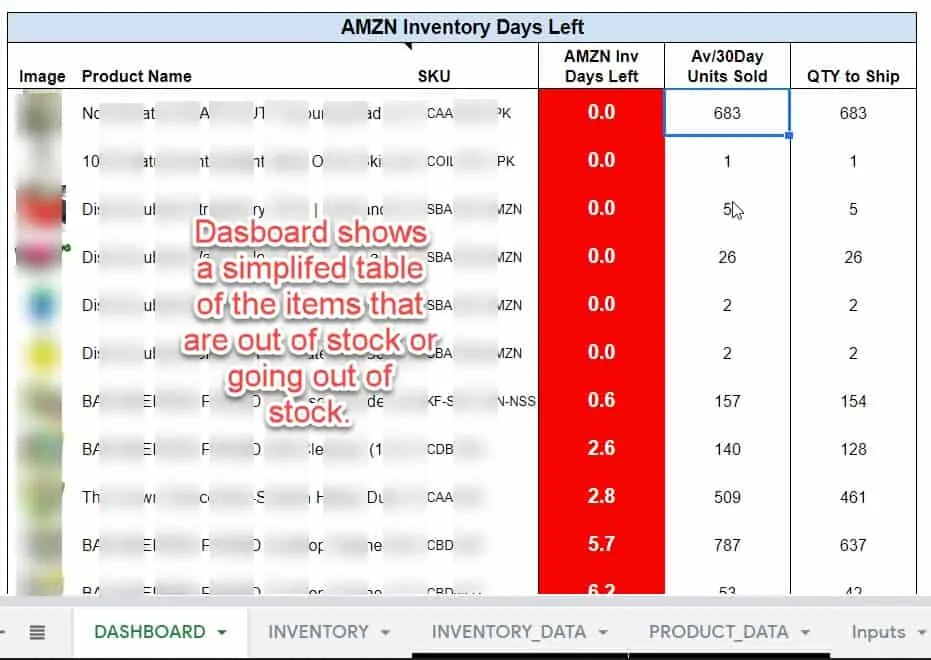
Amazon Inventory Management Dashboard
Amazon Sales and Profit Dashboard
Simplify getting data for your dashboards
The hardest, most tedious and draining part of working with FBA dashboards is getting the data.
If you have good design sense, create the nice looking layout is simple. It’s just a bunch of tables, charts and colors. Spreadsheets make it super easy to create dashboards.
Use our addon to automatically load all your Seller Central Data inside Google Sheets. Stop working for data. Let data work for you.
- Download the Gorilla ROI Amazon to Google Sheets addon
- Follow the getting started instructions to authorize and connect
Downloads Page: FREE Amazon Seller Dashboards and More Spreadsheets
Getting sales data for your dashboards
If you want a sales dashboard, you can pull Amazon data for various sales periods and also at a SKU level using our sales related formulas.
To pull units sold, you can do something as simple as:
=GORILLA_SALESCOUNT("THIS YEAR")
and for more control over what data you want to pull:
=GORILLA_SALESCOUNT("THIS MONTH", "ALL", "IPHN3724", "SHIPPED")
The syntax of the formula is
GORILLA_SALESCOUNT(PERIOD, [MARKETPLACE], [SKU], [STATUS], [MCF], [START_DATE], [END_DATE])
By automating the data import process, you can create your own highly flexible and custom sales dashboards that perfectly fit your needs.
Getting Amazon inventory data for dashboards
If you expand into advanced Amazon seller dashboard territory, consider inventory dashboards to improve your operations and performance as a seller.
On your Amazon Seller Central account, there is nothing that helps you much regarding Amazon inventory management.
You can get sales data by clicking and downloading multiple reports and doing a lot of wasted manual work, but if you combine sales and inventory, your Amazon seller dashboard will be unbeatable.
- See sales data on a SKU level for last 7, 14, 30 days and how it affects inventory.
- Create your own velocity calculations based on sales data AND inventory in stock.
- See what the max restock levels are compared to sales.
Sales and inventory go hand in hand.
=GORILLA_INVENTORY(A1:A100, "US", "INBOUND_RECEIVING")
The syntax is as simple as entering the SKU, marketplace and what inventory status you want to look up.
GORILLA_INVENTORY(SKU, [MARKETPLACE], [STATUS])
To get inventory restock reports and data, it’s as simple as:
=GORILLA_INVENTORYRESTOCK(A1:A100)
You can make the formula as simple and broad as you want. Or get deep and detailed data points by following the syntax and documentation.
GORILLA_INVENTORYRESTOCK(SKU, [MARKETPLACE], [CONDITION], [DATAPOINT], [HEADER])
Creating Amazon seller dashboards for FBA and FBM
Now you know how to automate the data collection whether you sell FBA or FBM.
Time to create your seller dashboards.
We have a very extensive step-by-step tutorial on best practices and how to create a sales tracking spreadsheet and inventory management system you can follow.
The brief version today is that if you want to create something like the example dashboards I show up top, it’s all about making the dashboard fully dynamic using advanced spreadsheet formulas.
Step 1
Use our Gorilla formulas to load the data into a table format to create your own database.
Step 2
Create a new tab and name it “Dashboard”. Use formulas such as
- VLOOKUP
- QUERY
- IMPORTRANGE
- Data validation drop down lists
- FILTER
to create a dynamic way of displaying the data from the table in step 1.
Downloads Page: FREE Amazon Seller Dashboards and More Spreadsheets
Dynamic formulas to make dashboards
VLOOKUP() – Google Sheets VLOOKUP explanation
Sample Usage
VLOOKUP("B088325DS", A2:B26, 2, FALSE)
Syntax
VLOOKUP(SEARCH_KEY, RANGE, INDEX, [IS_SORTED])
In the example formula, it is best to use a cell reference instead of manually entering the ASIN into the formula.
VLOOKUP searches for the ASIN or SKU from the table that has all the data and then loads the matching values for “last 7 days”.
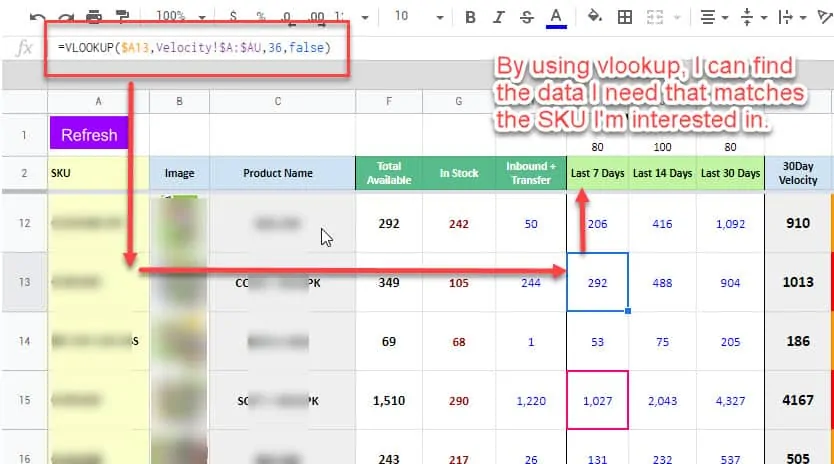
Use VLOOKUP to eliminate manual data entry.
If you do a formula like =I13 to link to the same cell, it does not work well if you add or remove rows and change your data table.
QUERY() – Google Sheets QUERY explanation
Super powerful function that you must know.
Knowing how to use QUERY() alone will take you from beginner level to advanced spreadsheet nerd status.
Microsoft Excel does not have this (ha).
This functions lets you truly use your spreadsheet like a database.
Sample Usage
QUERY(A2:E6,"SELECT AVG(A) PIVOT B")

QUERY(A2:E6,F2,FALSE)
This is how we use it for our Amazon sales dashboard.
QUERY is used only on the dashboard tab and not in any of our data tables as it is a dynamic formula and should only be used to pull information and display it.
It is the king of finding information in a big messy table and displaying only what you want to see.
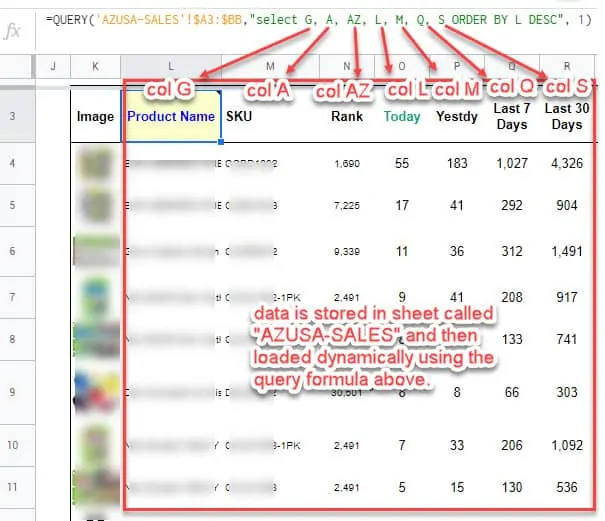
=QUERY('AZUSA-SALES'!$A3:$BB,"SELECT G, A, AZ, L, M, Q, S ORDER BY L DESC", 1)
My query formula is getting the data from columns G,A,AZ,L,M,Q and S from the tab “AZUSA-SALES”.
It then tells the query formula to sort it in descending order based on the data in column L of the AZUSA-SALES table.
The result is what you see in the screenshot above.
IMPORTRANGE -Google Sheets explanation
To link multiple files together, use this function.
Let’s say you have sales data in a spreadsheet file called “Amazon-Sales” and another spreadsheet file for “FBA-Inventory”.
Each spreadsheet is separate. You can create a new file called “Sales-Inventory-Analysis” and then import the data from both spreadsheets using the IMPORTRANGE formula.
Sample Usage
IMPORTRANGE("https://docs.google.com/spreadsheets/d/abcd123abcd123", "sheet1!A1:C10")
IMPORTRANGE(A2,"B2")
This way, you can combine different files into a central spreadsheet and also keep it separated as you may not want to combine all the data into 1 file.
If you have a gargantuan spreadsheet, this makes even more sense.
Seller dashboard design tips
The goal is to make it 100% hands off and automated.
- Don’t type in unique values into your formulas.
- Don’t enter values into the dashboard anywhere
- Don’t clutter the dashboard
- Don’t create too many different chart formats
- Don’t use too many colors
The keys to a well designed dashboard are:
- Use labels as much as possible
- Breathing space between objects
- Non high contrast or blinding colors
- Max TWO different types of charts
- Simple is always better
Downloads Page: FREE Amazon Seller Dashboards and More Spreadsheets
Comments
Related Posts
Mastering Shopify’s UTMs: The Simple Way to Smarter Marketing
Let’s be honest: marketing your Shopify store without tracking what’s…

10 Profitable Product Categories for Amazon Affiliates 2025
What you’ll learn Amazon is a favorite for experienced and…

Unlock the Secret to a Profitable Automated Amazon Store: How to Build a Hands-Free Income Stream
Ever dreamed of running a profitable Amazon business while sipping…


Leave a Reply