Article Summary (TL;DR)
✅ Strategies to deal with hijackers on Amazon listings, emphasizing the importance of detecting unauthorized changes quickly.
✅ A basic spreadsheet setup to monitor changes in product images and titles, which are common signs of hijacking attempts.
✅ Several tips including monitoring reviews, saving money on review pulling services, and forecasting inventory to prevent stockouts using GorillaROI formulas in Google Sheets.
Tip #1: Hijacker detection system
Normally, we don’t get hijackers on our listings.
If we do, it’s usually the weak kind. The type of seller who folds their card as soon as we send them a message to get off.
This week is different.
This is the type of seller you don’t want to deal with directly.
You’re probably aware that China sellers have a network of people and services they can use to attack and damage your business.
This seller isn’t attaching himself to directly to our product and selling fakes – which is a relief. Instead, he is creating variations under our listing and trying to leech off our stellar reviews.
Luckily, I was able to detect something was strange within a couple of hours and went into action.
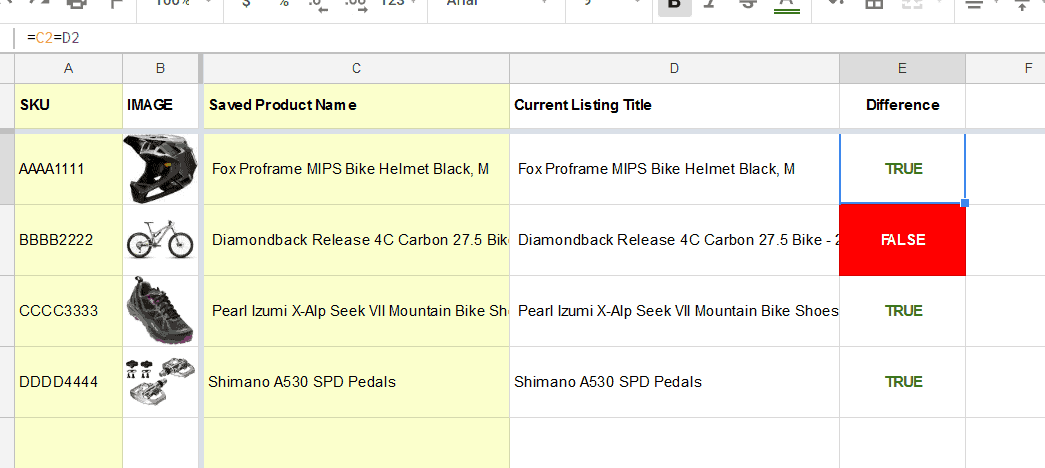
Here’s a basic spreadsheet I have set up for this exact reason.
The only thing this spreadsheet does is to let me know whether my title and image has changed without my consent.
When malicious hijackers targets your listing, they will always
- change your image or
- change your title
Since we don’t have thousands of SKU’s to deal with, I scroll down and found that some of our images have changed. In the example above, if my helmet image suddenly changed into an electric dog collar, I immediately know something has been changed.
Next I quickly check if the title is different or not.
I set up a simple conditional formatting where I manually entered my original title in column C. Then in column D, I have Gorilla ROI load my titles as it appears on Amazon.
Column E is a simple formula to check if it is the same or not.
=C2=D2
If it is the same, the value returned is “true”. If it returns “false” the cell changes to red for immediate attention.
How to create this spreadsheet yourself
Load the product thumbnail with
=image(GORILLA_PRODUCT("SKUorASIN", "smallimage_url"))
Enter the correct title manually into column C.
Then in column D, use the formula:
=GORILLA_PRODUCT("SKUorASIN", "title")
Column E is a simple formula to check whether the titles match each other.
=C2=D2
Add some conditional formatting and you’ve got yourself a simple, flexible and customizable hijacker monitoring system.
Tip #2: Send yourself daily reports
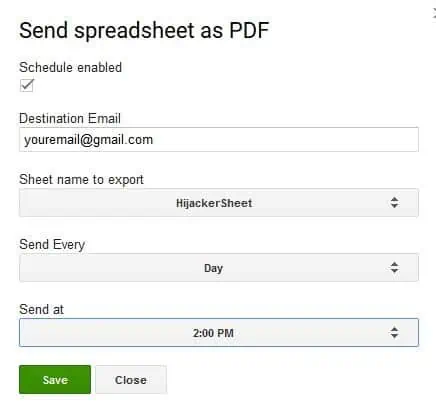
If you create a spreadsheet like the one above but don’t want to open it every hour, there’s a feature in the addon where you can send yourself a PDF export of the spreadsheet to your Google email.
Go to menu > Add-ons > Gorilla Sheets > Send Spreadsheet as PDF

Make sure to enter your Google email used to install the add-on.
It will NOT send to any other email than yourself to prevent the function being used in a spammy way.
Save the settings, and get your daily report automatically and stay on top of your business.
Another automation tip is to create a filter in your gmail so that this daily email is then forwarded to your team.
Tip #3: Monitor reviews and save $$$
I don’t know anyone who enjoys 1-star reviews.
And let’s face it.
Amazon customers are a different breed in terms of pickiness and entitlement. So staying on top of reviews and being proactive to rectify situations and to please customers can go a long way.
We’ve found that even commenting on negative reviews with a helpful response does wonders to inspire confidence for other buyers. The great thing with leaving responses to reviews is that you get the last word.
Customers don’t come back to their reviews and Amazon does not notify them of a response.
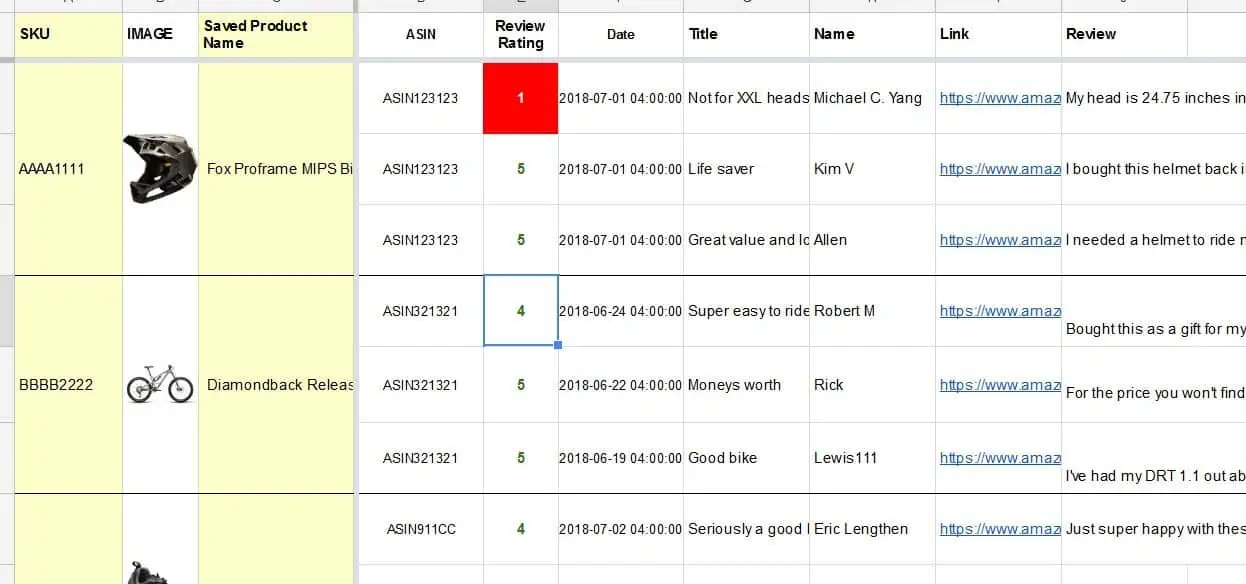
Use the simple formula below to create a basic review monitoring spreadsheet.
=GORILLA_REVIEW("SKUorASIN" ,"US", 3)
This formula is telling GorillaROI to pull the Amazon review for your SKU or ASIN, in the US marketplace and then display the latest 3. You can enter whatever number you want at the end. Change it to 10 and it will display the last 10 to your spreadsheet.
Apply some basic conditional formatting for instant magic.
If cost-cutting and saving money is your thing, this spreadsheet means you can probably cancel the review pulling service that costs at least $100/mo.
Tip #4: Forecast inventory and prevent stock out
Going out of stock is another way of losing money that sellers don’t think about.
If a product goes out stock:
- it loses sales velocity and a competing product will take its place
- you have to increase your PPC bid in order to regain your original sales rank and position
- you may have to spend more to get it delivered quicker
- you lose revenue
If it’s one of your best sellers, it quickly becomes a lose-lose-lose situation.
To forecast your future inventory requirements and sales, you can look up your sales figures from the same time last month, or last quarter or last year and then project it forward.
Here are two basic methods of a 3 month simple Amazon inventory forecasting.
Method 1.
Get the total units sold throughout the last 3 months.
=GORILLA_SALESCOUNT("LAST 3 MONTHS", "US", "SKU", "ALL")
Multiply the number by 3 to get a linear forecast based on the past 3 months. Compare with your current numbers and order as needed.
Method 2.
- Get the last 7 days of units sold and divide by 7 to get the average daily units sold.
=GORILLA_SALESCOUNT("LAST 7 DAYS", "US", "SKU", "ALL") / 7 - Get the last 30 days of units sold and divide by 30 to get the average daily units sold.
=GORILLA_SALESCOUNT("LAST 30 DAYS", "US", "SKU", "ALL") / 30 - Get the last 90 days of units sold and divide by 90 to get the average daily units sold.
=GORILLA_SALESCOUNT("LAST 3 MONTHS", "US", "SKU", "ALL") / 90 - Calculate the average of steps 1, 2 and 3 to get a smooth daily number of units sold.
=AVERAGE( numbers from 1,2,3)
- Multiply the number from step 4 by 90 to get a forecasted 3 month projection.
= number from step 4 x 90
There is so much more you can do with your seller data once you import it into Google Sheets.
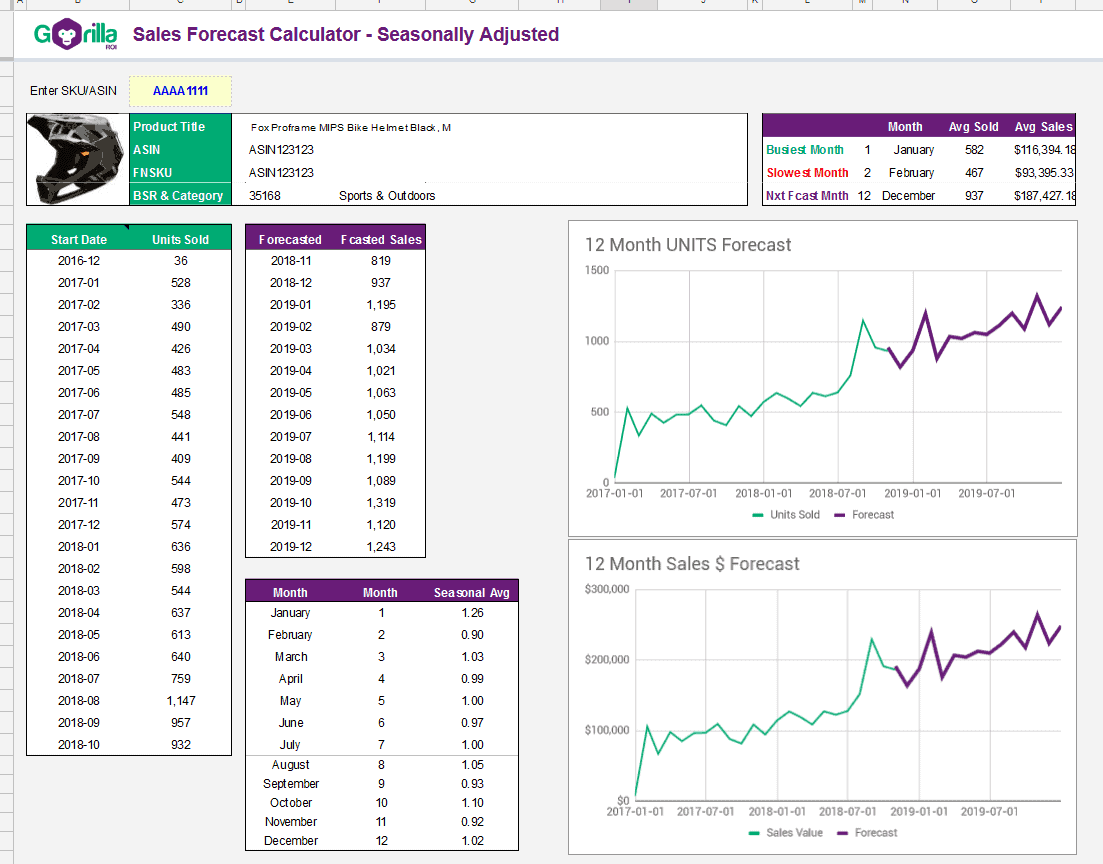
A more advance version is to forecast by seasonality. That is something our forecasting calculator (free preview) does for you if own the Business PRO Package.
If you know spreadsheets, let your creativity roam.
- Use the data to create beautiful dashboards
- Create automatic sales report generation
- Monitor and track sales by month and see your growth
- Utilize advanced spreadsheet formulas to perform spreadsheet magic everywhere you go.
Comments
Related Posts

Shopify eBay Integration for Busy Sellers: Sell Like Crazy Across 2 Channels
Using an omnichannel sales strategy can help your business reach…

Understanding Shopify COGS: A Comprehensive Guide for Business Owners
Knowing your Cost of Goods Sold, or COGS, is essential…

Boost Sales With Shopify Automation – BONUS: Our 3 Best Shopify Automation Apps
Being an e-commerce company, in particular, means that you have…


Leave a Reply