
Here’s the current Gorilla ROI Amazon sales progress. To see the interactive version, go to our income reports page.
Note: These monthly updates are for educational purposes.
Article Summary (TL;DR)
✅ Explore the performance metrics and milestones achieved in January for our FBA business, reaching $600K in sales.
✅ Gain insights into the challenges faced and lessons learned during the month, highlighting opportunities for improvement and future growth.
✅ Learn about the strategies implemented to drive sales growth, including inventory management, pricing optimization, and marketing efforts.
This year has started with a bang, but as I write this in February, I’m not looking forward to writing next month’s report.
So many things have gone wrong in February that it’s hard to even remember what happened in January.
Agenda in this post.
- January summary
- The new target of $10M and the continuing this monthly report
- Plans for this year
- New highly requested Gorilla ROI functions and data
First, the numbers as usual.
January stats
- $600k in sales
- 113% growth from the same month last year
- 21% growth from the previous month
- Conversion rate of 35%
- ACoS is 27.1%. TACoS was 12.4%.
- Jan Sales to Inventory ratio was 2.75 (higher is better)
- Last month Sales to Inventory ratio was 1.78
I started sharing the Sales to Inventory ratio recently. The higher the ratio, the better. To get more detail on how to interpret it, also check the year end 2020 report.
New target of $10M
With $5M in the rearview mirror, I needed a new target if I was going to keep writing this monthly report.
Something big enough, but not outrageous like $100M.
I’m a big fan of working backwards. I don’t like reinventing the wheel or trying to create something revolutionary like an underground electric small passenger transportation system.
Setting these revenue goals is helpful because I already know what my margins are and where it comes from. So when I set a goal like $10M, it’s much easier to go through in reverse order and find that one big variable that will move the needle.
If you are new to this blog, I sell sub $20 products. The average order value is in the $16 range. Not high at all. It’s the type of product and price range that YouTuber gurus tell you not to do.
I compete against Amazon and massive global brands. I think this helps me because it scares away a LOT of small competition and what I’ve found is that the smaller sellers are more difficult to deal with.
Global brands are slow and aren’t great at the Amazon game. It’s the smaller sellers who are ultra-aggressive and cutthroat. They eagerly race to the bottom.
Now to get to $10M, the easiest step is for us to go after higher-priced products. Products in the $100+ range where possible.
- Our operations are in place.
- If we can handle low margin/high volume products and come out on top, I know we can easily handle high margin/low volume products.
- PPC theoretically should come down as a percentage as we have more room to play with.
- We’ve created our own product launch process to get a product ranking quickly.
The hardest part is keeping it within the same brand identity as I don’t want to create another brand. I’ve done that 2 times already and hasn’t worked out well because the categories were too different.
Much easier to expand within tight family lines as I can keep cross selling and cross promoting the new product by leveraging existing products.
Plans for 2021
I shared in the Dec report that our biggest fail was lack of new products. Our new products came in December and missed out on all the great seasons.
- The first big focus will be to go after higher priced items.
- The second focus is launching new products more frequently.
- The third is staying on top of shipments (domestic and international)
The first two alone should put a huge growth wind in our sails. We have an extensive list of products in each of the research, design and manufacturing phase. We’ll literally be able to double or triple our current SKUs which also means killing existing underperforming or expensive SKUs.
Going to be a capital-intensive year with all the new designs and products coming out, but no pain, no gain.
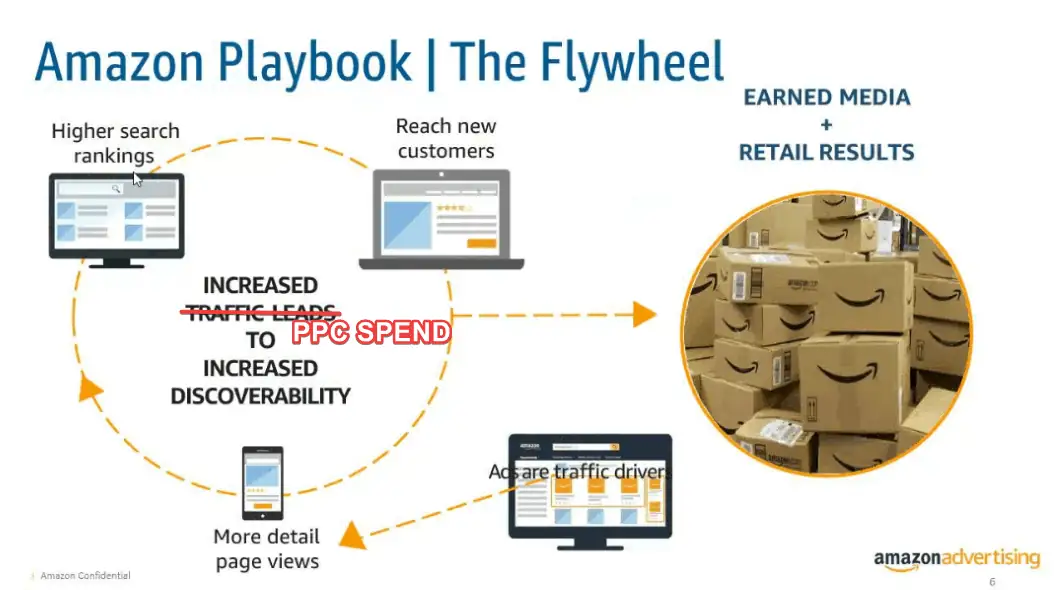
PPC is an area that needs lots of attention this year. I can already see the big jump in ad spend. People are bidding up like crazy and trying to outspend hoping that their competition goes out of business.
Without PPC, there is literally NO way to get discovered. What used to be a smaller percentage of ad spend keeps increasing and will continue to increase. Amazon will keep coming up with new spaces to display ads and push them to sellers.
It’s definitely killing some of my products as more sellers have crowded my niche. Just not profitable anymore.
ACoS on some products are at 50%+ and it’s not coming down no matter what. Automated PPC software doesn’t work. It actually made many of them worse because there’s nothing on the market that is smart enough. Still needs a person to detect trends, anomalies and anticipate.
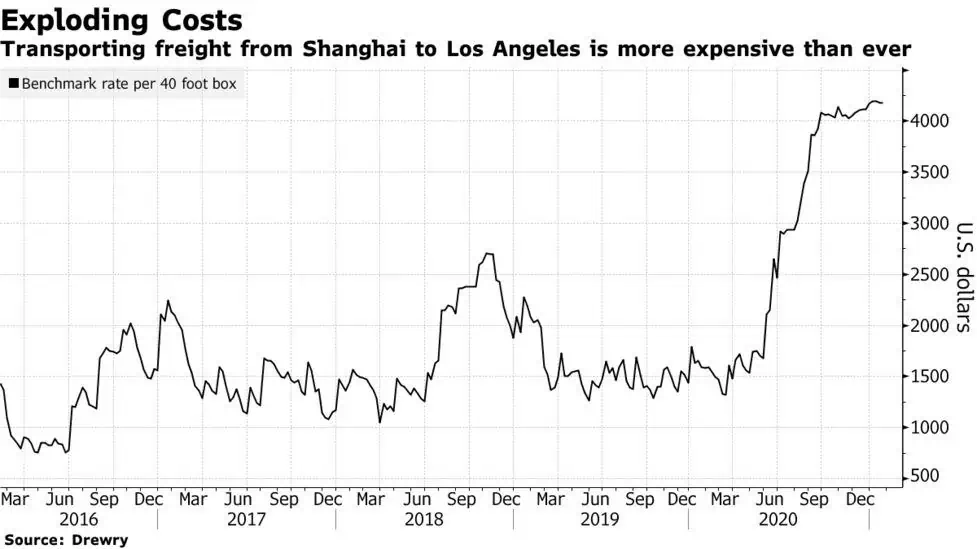
I’m literally seeing 3x cost increases in freight across the board. It’s eating up margin like crazy. And it’s not easing up. Ports are backed up and getting a booking and disembarking is so hard and long. If you aren’t checking freight costs and space available until the last minute, you will be in for a rude shock.
If you run out of stock, will you
- ship small quantities via air and pay 3-4x the price?
- let it run out of stock?
Both lose-lose situations, but that’s the reality at the moment.
Highly requested Gorilla functions and data
We’ve been busy adding more important data points to make your life easier.
New updates and features
Deadline to switch is March 31.
-
NEW: Video instructions have been created for every function showing how to use and what each one does.
-
NEW: Subscribe N Save features.
SNSFORECAST() and SNSPERFORMANCE(). Loads SNS forecast and performance data based on a date.
-
UPDATED: ASINLIST() and SKULIST(). More control. You can list "active" only, "inactive" only or "all" ASIN/SKUs as well as by FBA or FBM.
-
UPDATED: PROFITLOSS(). Many new transactions and items from Amazon which have been categorized for you. Easiest way to create your own custom profit loss statement for 2020 or by month.
Articles published
- My take on the latest fad of “done for you” Amazon automation businesses. I went overboard on this one. Lots of details, breakdowns, calculations etc.
- I get way too many questions about making Amazon seller dashboards. Here’s a guide on creating your own.
- The ProfitLoss() for some reason is hard for some people. This one is another detailed guide and I’ve included a free download of an Amazon profit calculator that you can also use as a profit loss template.
More free Amazon FBA spreadsheets for all
We’ve added more templates for both basic users and PRO spreadsheet buyers. More free Amazon spreadsheets are being created too.
You can download it immediately without having to sign up for anything.
Just copy straight to your account.
If you have custom spreadsheets you use in your business already, you can automate it with our Gorilla ROI addon. Tons of flexibility to create the reports that work for your business.
Comments
Related Posts
Mastering Shopify’s UTMs: The Simple Way to Smarter Marketing
Let’s be honest: marketing your Shopify store without tracking what’s…

10 Profitable Product Categories for Amazon Affiliates 2025
What you’ll learn Amazon is a favorite for experienced and…
Unlock the Secret to a Profitable Automated Amazon Store: How to Build a Hands-Free Income Stream
Ever dreamed of running a profitable Amazon business while sipping…







Leave a Reply