.svg "Gorilla ROI")

Article Summary
✅ Learn the importance of efficient inventory management for Amazon sellers to avoid stockouts and excess inventory.
✅ Explore strategies for forecasting demand, replenishing inventory, and minimizing storage costs to maximize profitability.
✅ Utilize tools and techniques for automated inventory tracking, order management, and warehouse optimization to streamline operations and improve overall efficiency.
Looking for a Google or Excel spreadsheet to use as Amazon inventory management tools?
You've come to the right place.
There is a working inventory management template at the end of the article you can download. It is the same version that I'll show you how to create in this article.
This article is split into two parts.
- Part 1 covers the important stuff of what you need to know and common issues.
- Part 2 goes through how to build your own inventory tracker too.
What this article is NOT about
If you are not an Amazon seller and looking for information on how Amazon actually operates its warehouse or inventory, this article is not for you.
I do not talk about their warehouse locations, how they pick orders with robots, seller fees, random inventory locations, barcodes, and so on.
This article on Amazon inventory management is for Amazon sellers who are looking to create their own Amazon inventory management system or looking for alternative Amazon inventory management software to handle their own operations.
Building the Amazon stock management spreadsheet
This is the inventory management spreadsheet I'll build with you here.
Here's the link to the final preview.
Before we dive into the technical details, some theory is required.
*Cue the eyeroll*
Yes, I know.
If you are an expert with spreadsheets and also a A-grade UI designer, then skip to the practical section titled "Basics to designing an effective Amazon inventory system"
Understand your Amazon inventory management system needs

Every seller needs a system to track and manage their inventory.
Ultimately on Amazon, there are two main types of Amazon sellers regarding inventory.
- You focus on a smaller number of SKUs
- Or you sell tens of thousands of different SKUs and do large volumes by combining the total sales.
The focus of this article will be on the first group of sellers.
Amazon sellers who focus on a small number of SKUs.
- Sellers who carry less than a thousand SKUs. Focuses on a smaller number of SKUs.
- Sellers who sell big volume with a smaller number of products.
- Sellerstorage fees with Amazons who don't have 30+ employees in the warehouse fulfilling products.
- Sellers who don't need an expensive full-blown Warehouse Management System (WMS) that easily eats up $2,000 a month to operate.
- Sellers who need nimble, flexible and creative Amazon inventory management software without being locked into enterprise software or a programming team.
- Sellers who don't need EDI interfaces.
Whether you sell $100k a year or $100M a year does not matter when looking for the best Amazon inventory system. The most important factor to consider for your inventory system is the number of SKUs you manage.
The number of SKUs in your inventory is the number one constraint of your inventory management system.
Why smaller operations should use Google Sheets as an internal Amazon inventory management system
The more SKUs you have, the more complex your requirements become. You've outgrown your existing excel based Amazon inventory management tracker you built.
You tested many Amazon inventory management software and tools, but feel like it has too many features you don't need.
It is a nightmare to try and handle 10,000 SKUs.
If you have more than 10,000 SKUs, stop reading this and look for alternative Amazon inventory management tools because at your scale, you need something powerful like a "warehouse management software" rather than solely focusing on inventory management.
That is what you need - not an inventory tracker or this type of inventory checker I'm building with you today.
But...
If you don't have thousands of SKUs, keep reading because the way we can help with Amazon inventory management may just work for you if you are looking for an easy, custom solution and you want to continue using Google sheets because it's an easy and flexible inventory management method.
Common inventory issues Amazon sellers face
Most sellers run into inventory problems at some point 一 and that’s ok. You just need to be prepared to handle the issues that inevitably pop up.
Find below some common inventory issues sellers face:
#1. Overstocking inventory
While you never want to run out of inventory, you don’t want to overstock your products either.
This can tie up capital you could otherwise use to replenish your faster-selling products and can cause you to accumulate costly storage fees with Amazon if you are using FBA.
If your product has over 90 days of supply and/or at least one unit aged over 90 days, Amazon considers its excess inventory. Remember, Amazon is not a storage facility but a fulfillment center. They want products to move in and out within 90 days — the quicker the better.
Excess inventory affects your overall inventory performance index score. Having too much inventory in Amazon’s fulfillment centers, will reduce your inventory storage limits and charge you monthly and long-term storage fees. These bills add up — sometimes to sums greater than the value of your unsold inventory.
If you have inventory stored in FBA, there are tools to help you determine if you have excess inventory, as well as address stranded inventory and long-term seller fees. Even if you’re using FBM (fulfillment by Merchant), your money may be tied up in slow-moving inventory. If you are using a third-party fulfillment center, you could be accumulating storage fees with them as well.
#2. Stranded inventory
Stranded inventory is a common issue many sellers don’t know how to fix. This happens when inventory stored in Amazon’s warehouse is no longer connected to an active listing on Amazon. It’s basically in limbo — it’s sellable, but no customers can actually purchase it. The worst part about stranded inventory is that even if your products are not listed for sale, you will still be charged monthly storage fees for each unit.
Luckily, Amazon will list the inventory that is stranded within your Inventory Dashboard. You just need to actively check this section often, as you will not receive alerts from Amazon.
#3. Long-term storage fees
Carrying excess inventory in an Amazon fulfillment center can rack up a large bill from Amazon, depending on how many of your stored units are considered long-term.
On the 15th of each month, Amazon assesses its entire fulfillment network to calculate the age of each seller’s stored inventory. Your inventory age is calculated from the day it arrives at FBA warehouses. Any inventory that has been stored for more than a year will be subject to long-term storage fees in addition to the usual monthly storage fees.
There are various inventory management tools and reporting within Seller Central that will help you avoid getting hit with long-term storage fees.
Some of these tools include:
Restock Inventory Tool
This tool will show you how many days of supply you have left for each product and the recommended replenishment amount to send into FBA.
Manage Excess Inventory Tool
This tool will show you each listing that may have excess inventory levels and will provide you with some action steps. It will also suggest things such as lowering prices or advertising to help move slow inventory.
FBA Inventory Age Tool
Learn how long your inventory has been stored in FBA and which units may be subject to long-term storage fees. This tool also shows you metrics such as estimated storage costs and identifies opportunities for you to increase your sales on stale inventory.
Stranded Inventory Tool
This tool will alert you to any stranded inventory you may have. From there, you should reactivate the inventory or remove it to prevent costly storage fees.
Manage FBA Returns Tool
This is where you can manage all of your FBA returns. See metrics such as return date, customer refund date, date return received, return status, and more.
We needed flexible inventory management
For our own Amazon inventory management system, we like to:
- monitor inventory data by SKU
- monitor inventory data several times a day, last 7 days, last 30 days, by each month, quarter, last 7 days, last 30 days, last 90 days, compared to last year
- create forecasts of the SKU we are interested in analyzing
- check past inventory sales velocity over any period we want (day, week, month, between any two dates)
To date, I have yet to come across a solution that offered the flexibility that we required in terms of being able to get the date ranges and data for specific SKUs quickly.
We always ended up having to export csv files from any inventory software and then feed it into our spreadsheet models for every date range we tracked.

It was a nightmare.
The dangers of running out of Amazon inventory
If you are still wondering if you need an Amazon inventory management solution, imagine this scenario. You run out of stock on Friday and have nothing to sell until Monday. It’s a nightmare situation. Customers want to buy from you, but you’re out of stock.
The major issues you might deal with on running out of inventory involves:
#1. Lost Revenue
Amazon doesn't allow back ordering so if you run out of stock, you will lose the buy box and the sale will obviously go to another seller.
#2. Lower product ranking
Running out of inventory frequently or for a long period has a very negative impact on your shopping search results. As per the search ranking algorithm of Amazon for discoverability, the availability of the products is a chief factor.
Also, it determines the product ranking on the search engines. Hence, if you’re out of stock for a particular product, the Amazon search engine wouldn’t list your product. And, if this happens frequently then there is a possibility that your Amazon product search results will fall off a cliff. Product rank will fall without a doubt if you go out of stock.
#3. Lack of seller reviews and latest products
It is quite tricky for the site visitors and shoppers to leave positive feedback on the product that doesn't appear in the search list. This might be a small thing; however, the reviews have a very positive impact on the seller’s profile and product listing. Therefore, it is a must to always maintain your Amazon store order & inventory to make your product appear at the top of the Amazon search engine.
That's why we built our Amazon inventory management system on Google Sheets + Gorilla ROI making use of our sales and inventory addon.
Google Sheets as a custom inventory management software
As I mentioned, unless you have tens of thousands of FBA or FBM SKUs in your inventory to manage, there's a good chance Google Sheets will work for your inventory management needs.
I've helped 6 to 8 figure Amazon sellers implement a custom inventory system based on our Google Sheets Amazon Business Spreadsheet Package. One company even sells more than $50M in revenue with a corporate structure. But a spreadsheet still works for them because not everyone has the work access privilege to their inventory management system or has the knowledge to use it properly and get the info required.
Spreadsheets are so easy to create, share and can be accessed by anyone in the company.
Basics to designing an effective Amazon inventory system
When creating spreadsheets, there are basics you must learn and apply.
Anyone can make a spreadsheet, and that's the problem.
You wouldn't build a house without going through your list of needs and then locking down your structure and design with an architect.
To make your spreadsheet life easier, you should apply the same concept if you don't want to end up with a spreadsheet where it seems like the toilet is smack in the middle of your kitchen.
The inventory sheet is going to be structured into 3 sections.
- Data
- Logic
- Presentation
Unless a spreadsheet is structured like this, you are going to have a monster on your hands. It will grow out of control quickly.
The rules for each of the three sections.
1. DATA SHEETS - STORES DATA ONLY
2. LOGIC SHEETS - ONLY CONTAINS FORMULAS AND GETS ITS DATA FROM THE "DATA SHEET". DOES THE OPERATIONS.
3. PRESENTATION - USES THE OUTPUT FROM THE LOGIC SHEET TO CREATE CHARTS, TABLES AND VISUAL PRESENTATION
For this Amazon inventory management tracker, the architecture looks like this.
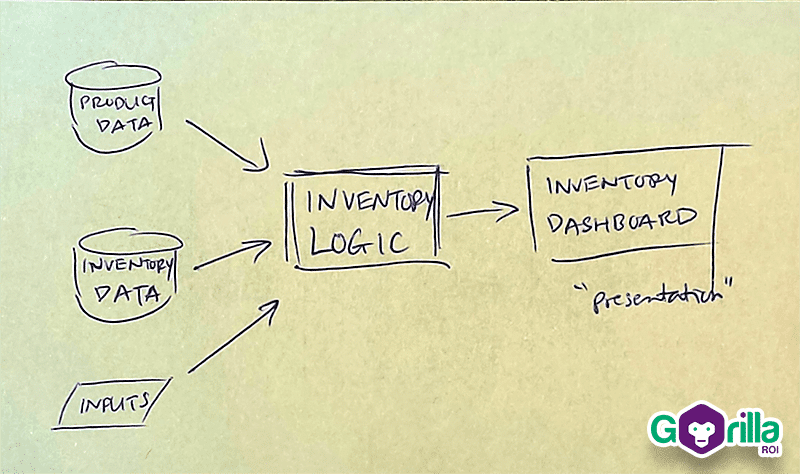
The DATA sheets
In this inventory/warehouse project, there are going to be two data sheets.
- One for product information such as the SKU, ASIN, FNSKU, that matches the Amazon information.
- One is for data to manage your inventory - such as how many of each sku is instock, transfer, inbound, and some basic sales data.
The LOGIC sheet
The middle "INVENTORY LOGIC" is the sheet that contains the formulas to combine and crunch the product data and inventory data into a useable format.
No data is manually entered into the logic sheet.

The logic sheet is 100% dynamic.
Typically, you likely built spreadsheets where the data and formulas are mixed together on the same page, but it is much easier to manage when you separate the spreadsheet tabs like this.
Here's why.
Let's say you want to add 10 new products to your current spreadsheet, change the ASIN and add dimensions.
Now what?
- you have to add 10 new rows or columns
- you enter all the product info
- you have to create formulas for the new SKUs
- you have to update all your formulas, graphs, tables because the entire data moved and is out of whack
Expect to spend the next 1-2 days (around 10 hours) trying to clean, test and fix up the bugs.
But if you use a logic sheet which simply runs the calculations by looking up the data sheet, all you do is update the data sheet with the extra data and that's it.
The logic sheet is set up so that it updates itself or with minimal maintenance.
This type of separation also makes it easy to scale your spreadsheet and share your spreadsheet without fear that someone will break it.
The PRESENTATION sheet
The hardest part isn't the logic, but the presentation. This is where you have to simplify the data to what you need. Not to cram as much as you can onto a screen.
What you don't want.

This is what you envision being able to share with your team.
The goal of the presentation sheet should be to keep it as simple as possible. Get straight to the point and deliver the key important message.
It should be a dashboard so the business owner or executives can understand what is going on in a split second without needing anyone to explain it to them.
If you need to explain what is on the screen every time, the presentation has failed.
We've gone through the design and the architecture. Keep it in mind as it will help you see the picture of how everything comes together.
Let's start building the structure.
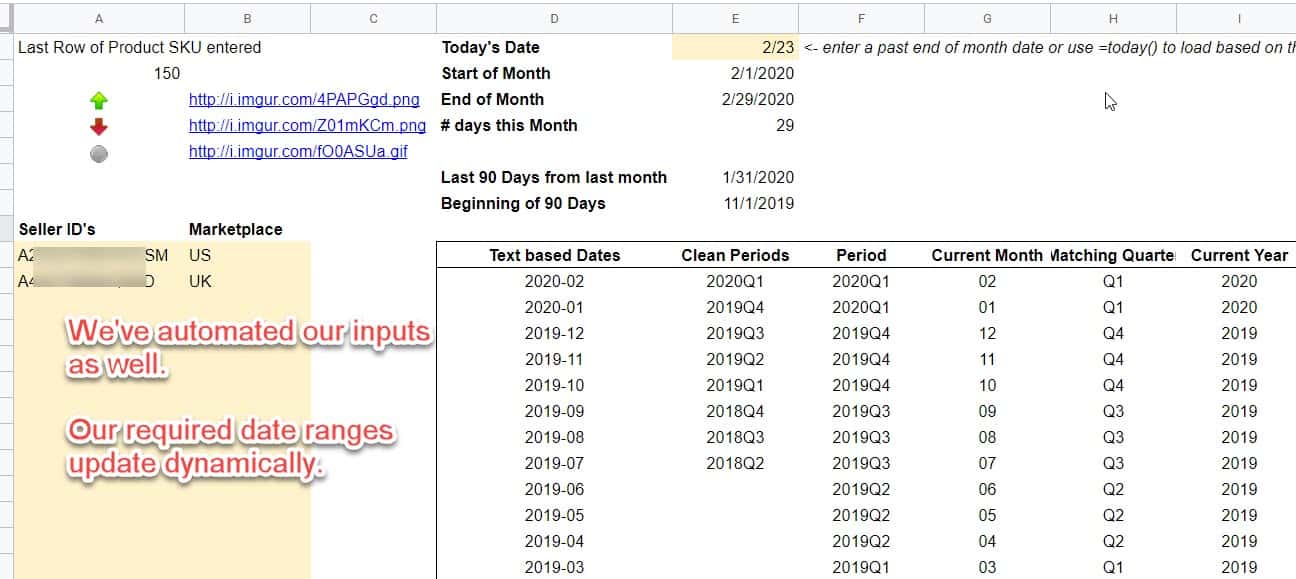
Building the INPUTS sheet
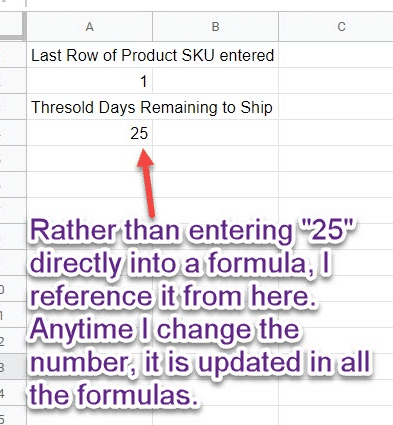
Every spreadsheet system, whether it be an entire inventory management process, or a single aspect, should have a dedicated space for input data.
This way, you are creating a centralized inventory management system.
Rather than plugging in an absolute value like "25" for 25 days in a formula, you can reference a cell like A4.
This way, if you need to change the number from 25 to 40, you don't have to find every formula that has "25". Referencing cells makes it a time process.
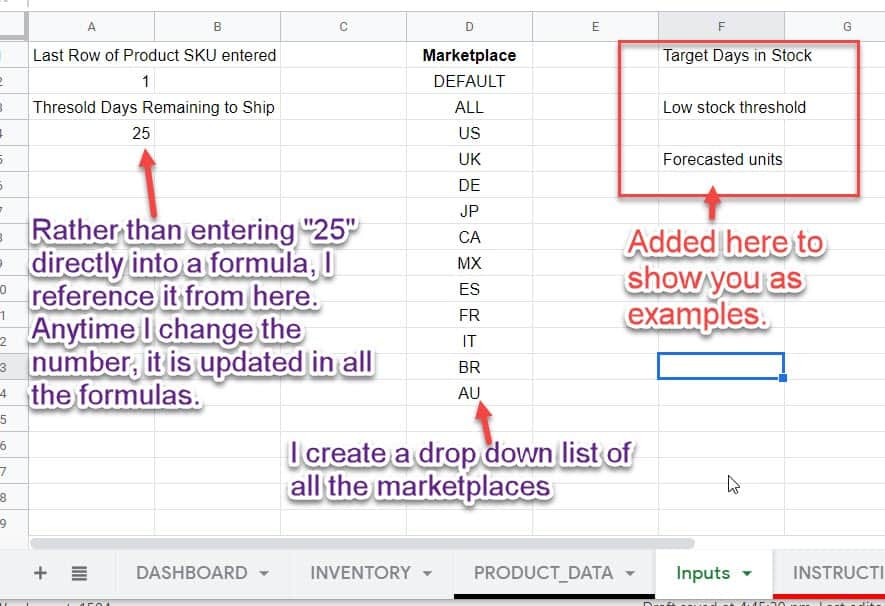
In my inputs tab, I like to keep it very simple. I have some formulas to help reduce steps like counting the number of SKUs, the low stock threshold alert, list of marketplaces.
In our internal Amazon inventory system, there is more information like a list of date ranges that we look up, quarterly deadline dates, seller ID's, table references and more advanced aspects that feed into our formulas.
It all depends on your needs.
Anytime you find yourself having to enter a hard value into a formula, move it to the Inputs section.
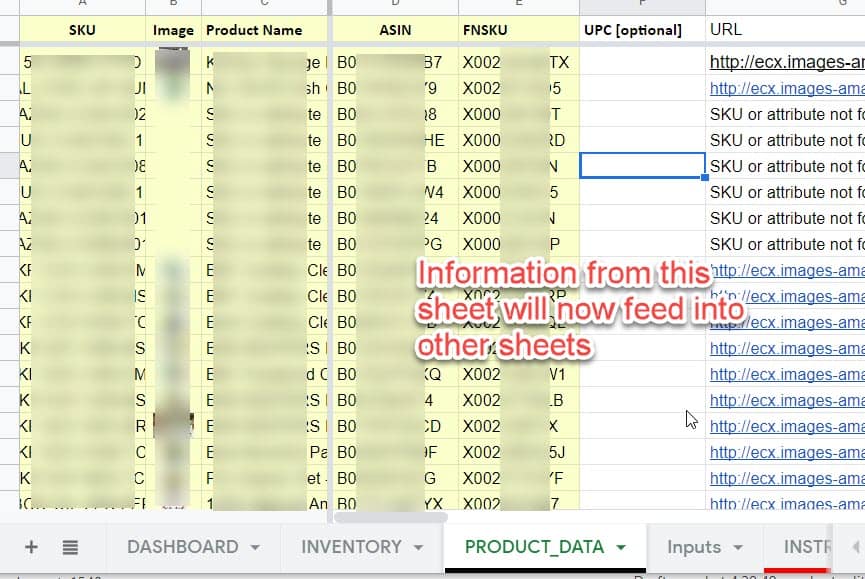
Building the product DATA sheet of your inventory management tools
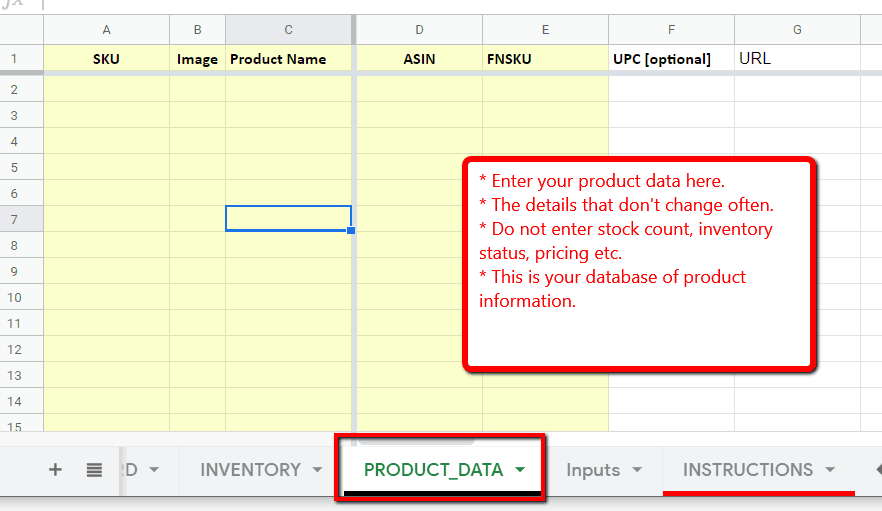
- Enter your product data into this tab like so.
- Enter the product details that don't change often.
- Do not enter stock count, inventory status, pricing etc.
- This is your database of product information.
You can put as many heading columns as you want. It doesn't matter as long as you keep it simple and only enter data that does not change often.
Remember, keep your inventory management tools and sheets as simple as possible. Not with a million things to update. The more inputs you are forced to enter, the less you'll use it - leading to poor inventory management.
Your SKU is unlikely to change, your ASIN is unlikely to change. Do not enter things like targets you are aiming for, sales velocity and other pieces of data that change constantly.
In our internal "master" product data tab, our headers include:

- SKU
- ASIN
- FNSKU
- MKTPL
- Image URL
- Image
- Product Name
- UPC
- Peak / Offpeak
- Unit/ case
- Category
- Rank
- My Price
- Leadtime (Days)
- Rec Order Lev in Days
- Suppliers
- Parent or Child
We've automated the data so that it gets pulled automatically, but you can enter this data manually as it doesn't change often.
The SKU is the unique number that we use throughout the spreadsheet to find, link, sort and filter data.
Getting back to the example, if you fill it out, it should look like this:
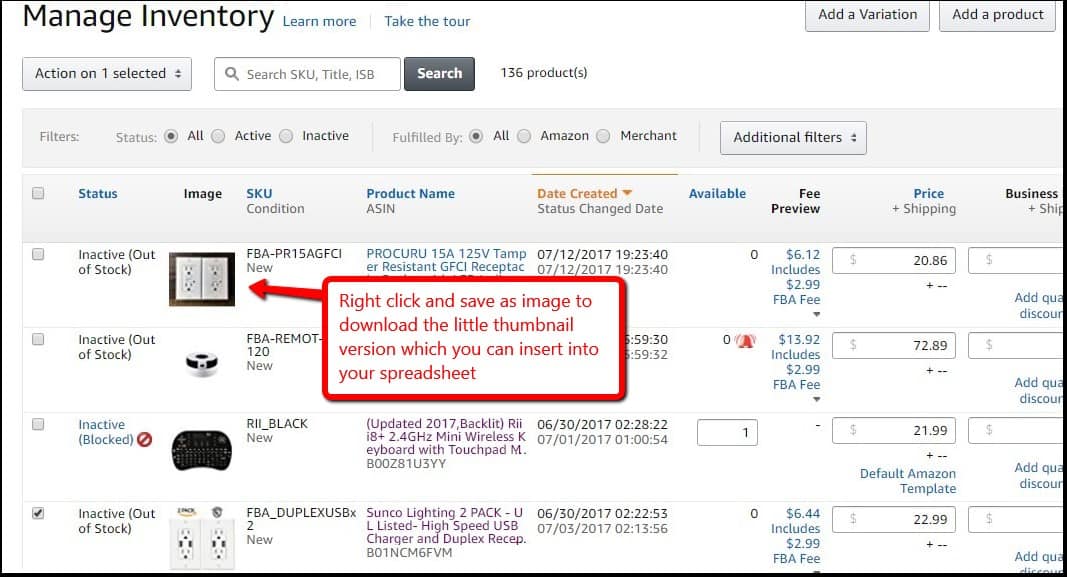
To get the little thumbnail images:
- go to seller central
- go to manage inventory
- right click on the thumbnail and save as image
- insert into your spreadsheet
Building the inventory DATA sheet
- The INVENTORY_DATA tab must have the SKU and ASIN to make your life easier
- You can fill this data by exporting your inventory reports from seller central
- Change the header titles as needed based on the data you need
The hard part with this is that the data for the inventory status needs to be updated regularly. This likely means you have to manually enter the data.
Pro tip: use Gorilla ROIinventory function to get the latest data automatically.
When the data is filled up, it looks like this.
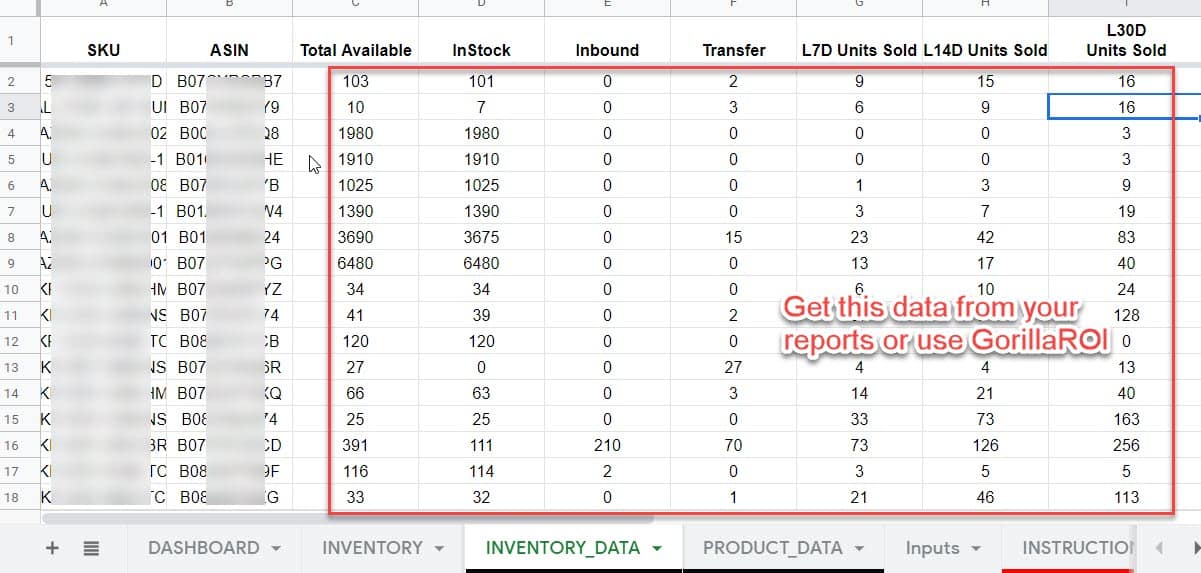
Because this inventory template is a simple version, you could combine this data inside "INVENTORY" rather than separating it out as I show here.
However, it's good practice to see how it comes together.
There is a detailed definition and guide to getting inventory data using Gorilla ROI add-on.
- Total Available = InStock + Inbound + Transfer
- InStock = inventory available and ready to ship by Amazon
- Total (or ALL) = fulfillable + inbound_working + inbound_shipped + inbound_receiving +reserved_transfer
- warehouse = fulfillable + unsellable + reserved
- fulfillable (instock) = inventory available and ready to ship by Amazon
- Local_Stock (only available for EU marketplaces)
- unsellable
- reserved = reserved_orders + reserved_transfer + reserved_processing
- inbound_working
- inbound_shipped (or “inbound”) = inventory on the way to Amazon's fulfillment center and has not been checked in
- inbound_receiving
- researching
- reserved_orders
- reserved_transfer (or “transfer”) = inventory has been checked in and being transferred to other fulfillment centers
- reserved_processing
Refer to the seller central page for more details on the manage FBA inventory report.
Building the inventory LOGIC sheet
Now we combine the data from PRODUCT_DATA and INVENTORY_DATA into this sheet.
This way, if PRODUCT_DATA or INVENTORY_DATA is updated with new data, this sheet will automatically update itself.
Let the spreadsheet do the work for you.
- Columns A to E is the information from PRODUCT_DATA.
- Columns F to L pull the info from INVENTORY_DATA.
The SKU is loaded by using a formula as simple as
=PRODUCT_DATA!A2
=PRODUCT_DATA!A3
...
=PRODUCT_DATA!A1000
Or you can use more advanced formulas like
=UNIQUE(PRODUCT_DATA!A:A)
or
=ARRAYFORMULA(PRODUCT_DATA!A:A)
The other columns for image, product name, ASIN is pulled using VLOOKUP.
VLOOKUP is also used to find and automatically display the inventory data points such as instock, inbound, transfer, last 7 days units sold etc.
You can see that the INVENTORY sheet has zero inputs. It's just a sheet with formulas that updates itself based on your inventory data at Amazon.
The VLOOKUP formulas use the SKU as the search_key to locate the correct data point to pull in.
- The red section in the screenshot above comes from the PRODUCT_DATA sheet.
- The purple section comes from "INVENTORY_DATA".
(Refer to the spreadsheet template directly to see the formulas for yourself.)
Since this is the logic sheet, this is where you can go wild with all your formulas to calculate stock rates, forecasts and anything else you know.
To keep it simple, I've added the following calculations:
- Av/30Day Units Sold
- AMZN Inv Days Left
- QTY to Ship
Av/30Day Units Sold - Average Last 30 days units sold
Rather than using the standard last 30 days, I like to normalize the data to try and account for any spikes.
That's why I have last 7 days, last 14 days and last 30 days in my inventory data sheet.
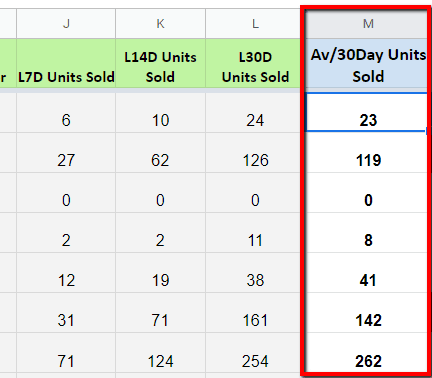
The formula to calculate this is:
=(Last7Days x 4 + Last14Days x 2 + Last30Days) ÷ 3
It converts the last 7 days and the last 14 days into a "month" equivalent.
Then the average is taken for the three values.
For an even more accurate assumption, you can use the calculation of:
=(Last7Days÷7)+ (Last14Days÷14) + (Last30Days÷30) ÷ 3 x 30
What this version does is normalize the 7 day, 14 day and 30 day sales into a one day figure. It then takes the average and then multiplies it by 30 to get the total average last 30 days units sold.
There are a lot of different ways to calculate the average 30 days or normalize it, and it depends on your needs and your business.
Since we have some seasonality like any business, our internal version has more layers to it. We combine it with weighting factors based on the current month.
E.g. we sell more in December and January, so our calculation puts more weight towards the last 7 days and last 14 days calculation during these months than the last 30 days.
During off-peak season, the weighting focuses more on the last 30 days.
AMZN Inv Days Left - Amazon Inventory Days Left
Inventory days remaining data at Amazon via seller central, is always one day late because Amazon generates the report once a day.
If you have fast moving inventory that you need to keep an eye on, the daily report by Amazon is not helpful. They also use straight-line calculation which simplifies the trends and cannot account for spikes and seasonality.
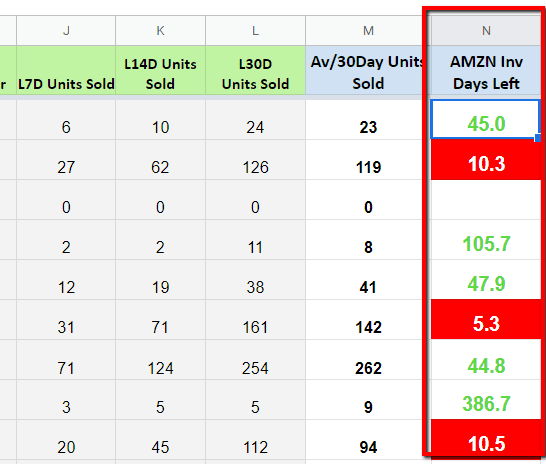
Hence the formula that I use to calculate the Amazon inventory days remaining.
=IFERROR((TotalAvailable ÷ Av30DayUnitsSold) x 30,"")
Remember that TotalAvailable = InStock + Inbound + Transfer.
The main aspect of the formula is (TotalAvailable ÷ Av30DayUnitsSold) x 30.
By using the average 30 days units sold, it compares against the total available inventory. This number is then multiplied by 30 to give you how the total days of inventory you have left at Amazon.
Here's a quick example.
- Let's say you have 100 units total available.
- Average units sold over the last 30 days is 25.
- 100 ÷ 25 = 4
- 4 x 30 = 120 days
The result is that there are 120 days of inventory remaining for your Amazon FBA account.
The IFERROR() function is used to make clean up the results. Rather than show an error on the spreadsheet, I like to display a blank space using " ".
If the last 30 days units sold is 0, then it would throw an error. Using IFERROR() in your Google sheets lets you control the output.
In Excel, you can use ISERROR().
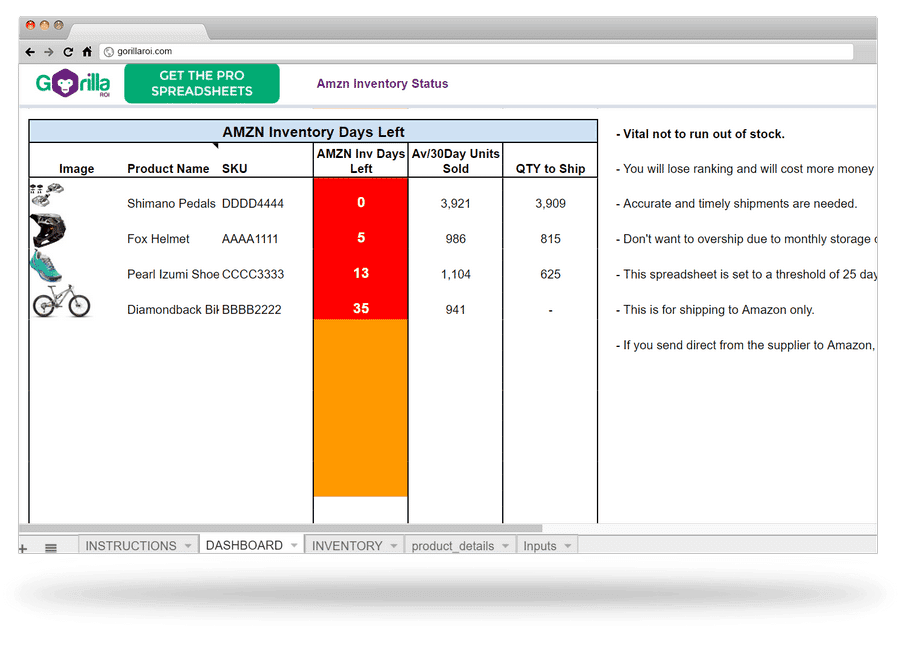
The spreadsheet inventory tracker gives a visual indicator where it turns orange when the days left in inventory is between 18 and 25.
It turns red when the days left is below 18.
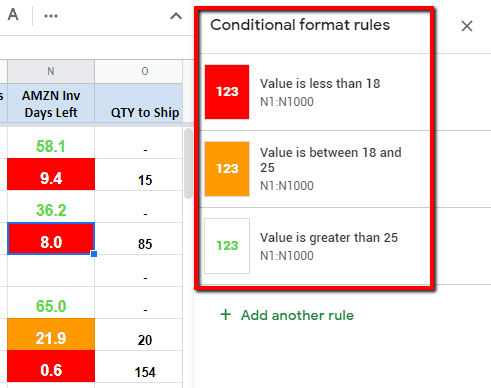
You can change the conditional color rules based on your needs.
QTY to Ship - Quantity to Ship
The last column to round out the logic section of the spreadsheet is to create a column that lets you know how many units need to be shipped to meet your inventory threshold.
In my example, I have alert threshold set to 25 days as indicated in the INPUTS sheet.
A value in the "QTY to Ship" appears when the AMZN Inv Days Left column is less than the threshold alert level (25 days).
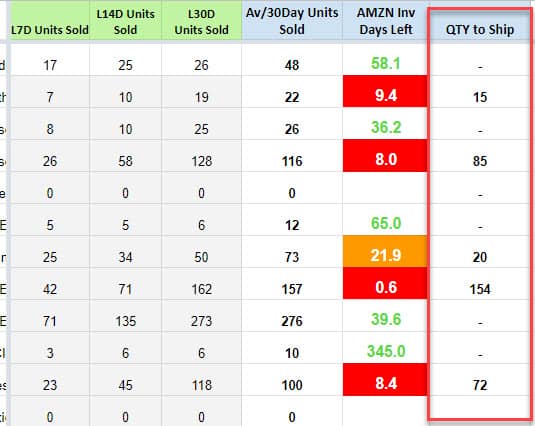
The QTY to Ship is then calculated to display how many units you need to ship to stock up for 30 days.
QTY to Ship = Av30DayUnitsSold -TotalAvailable
It's as simple as checking how many units are available at Amazon, then subtracting it how many were sold the last 30 days.
If you have 100 units at Amazon, and you sold 300 units in the last 30 days, then you should send in 200 units.
QTY to Ship = 300 - 100 = 200 units to ship
If you need to ship more units than 30 days, then Av30DayUnitsSold has to be changed to be Av45DayUnitsSold.
A shortcut formula to do this is:
QTY to Ship = Av30DayUnitsSold x 1.5 -TotalAvailable
Since 1.5 x 30days = 45 days, you can multiply the last 30 days units sold by 1.5 to get an estimated last 45 days sold.
This way, the QTY to ship would now be the total units to reach 45 days of inventory at Amazon.
With all this, the final result of the inventory logic sheet has a nice, clean table with the key data points we need to make decisions without getting overwhelmed.
Advanced option for better accuracy
For higher accuracy and more robust inventory system, you can set it up by peak vs off-peak.
Assuming you are good with spreadsheets, you can set up formulas to detect whether the current month is a peak or offpeak month. If it is a peak month, make it calculate using the Last45Days units sold.
If it is offpeak, use the standard formula above.
This way, you can control how much inventory stock is sitting at Amazon warehouses. No need to pay extra for storage fees.
The cost of holding inventory at your own warehouse or even a 3PL will likely be cheaper than sitting in Amazon's warehouse during peak seasons like Christmas.
Building the dashboard PRESENTATION
So far, we've created all the sheets except for the presentation dashboard as shown in the architecture.
- INPUTS hold numbers and other references that we want to change as needed.
- We got the product data inside PRODUCT_DATA.
- Inventory data is coming from INVENTORY_DATA.
- INVENTORY pulls in the needed data from INPUTS, PRODUCT_DATA and INVENTORY_DATA to give a nice usable table.
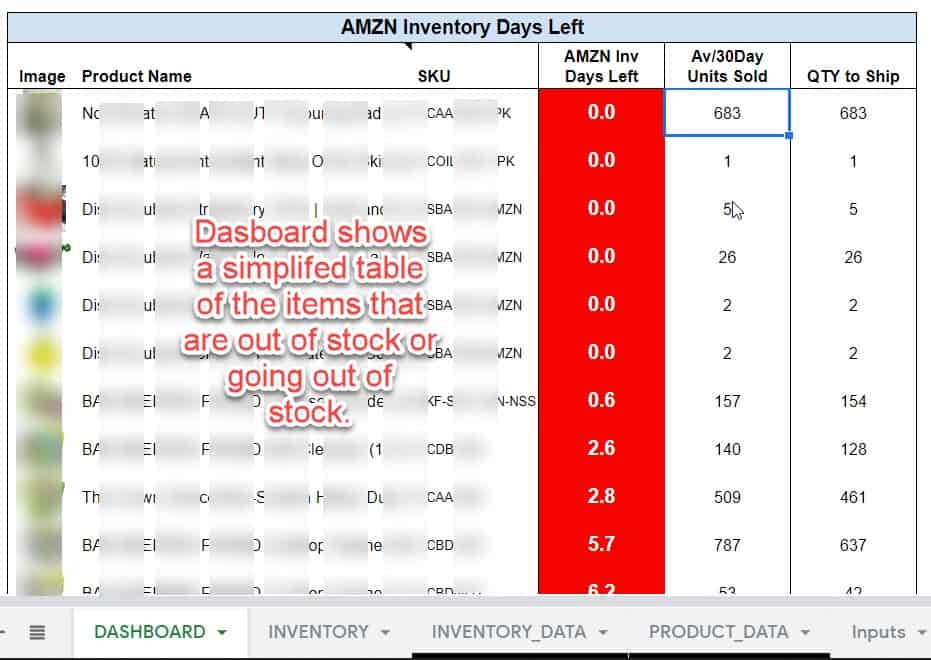
You could end it with the INVENTORY sheet. But I want to simplify it further by having a dashboard display a table with the 15 lowest inventory stock.
A simplified version of the INVENTORY table will help you quickly see which products are out of stock or about to go out of stock and act accordingly.
Imagine if you have a 1,000 SKU list or you manage multiple accounts.
Do you want to go through a massive table every day and find the SKUs manually that need to be prepped and shipped?
Or would you rather have a neat and summarized data table ready for you?
This type of simplified table helps you:
- identify what needs to be done
- drill down to the next stage by looking up the data
This final table is easy to build. The majority of the grunt work is in making it look pretty.
The main formula that I personally use to create dashboards is by using QUERY().
It's an advanced formula, but once you understand the concept and usage, it is a lifesaver. It saves so much time, can create tables and data on the fly.
All I need to use is one QUERY formula as shown below to auto-generate a filtered table of results.
=QUERY(INVENTORY!$A:$Y,"select C, A, N, M, O WHERE N IS NOT NULL ORDER BY N ASC LIMIT 15", 1)
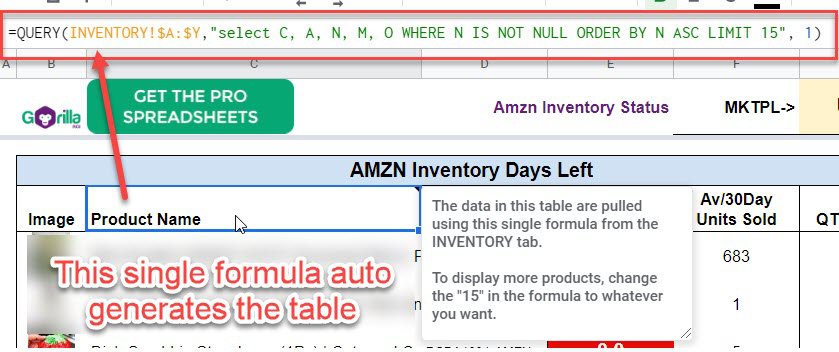
The formula is saying:
- Use the data from INVENTORY sheet, from column A to column Y.
- Then grab the info and numbers from column C, A, N, M, O
- Make sure the numbers in column N are not null (not an error or non-existent)
- Display all the results in ascending order based on column N
- Display only 15 results
This QUERY formula is a hard worker. Creating a table by using equals formulas and VLOOKUPS should be left for the logic sheets. Presentations should be built with QUERY where possible.
The possibilities are endless once you understand how to structure spreadsheets and make use of data.
You can create charts to track inventory. This is a chart of ours that tracks when a SKU needs to be reordered, and how many days of inventory remains at Amazon and our warehouse.
Automate inventory management with our Google Sheets Addon
If you already have an Amazon inventory management process to track inventory at Amazon and your physical warehouse location, the next logical step is to automate and load the inventory data directly without having to log into your account and export reports.
That's where Gorilla ROI comes in. It is a Google Sheets add-on that connects to Seller Central and loads your Amazon seller data directly into Google Sheets.
If you have more than 20 SKUs and you are copying and pasting data manually into your models, you know what a hair-pulling experience it is.
If you are growing, your forecasting or inventory management system needs flexible and dynamic data, without requiring you or someone in your team to manually feed it information.
Here's how easy it is to get started with our addon for inventory, sales, product, reviews, fees data and more.
- Authorize Gorilla ROI to your Amazon seller account
- Install the addon on your Google account
- Activate the addon from the Google Sheets menu
- Wait for data to be imported (6-24hrs depending on your size)
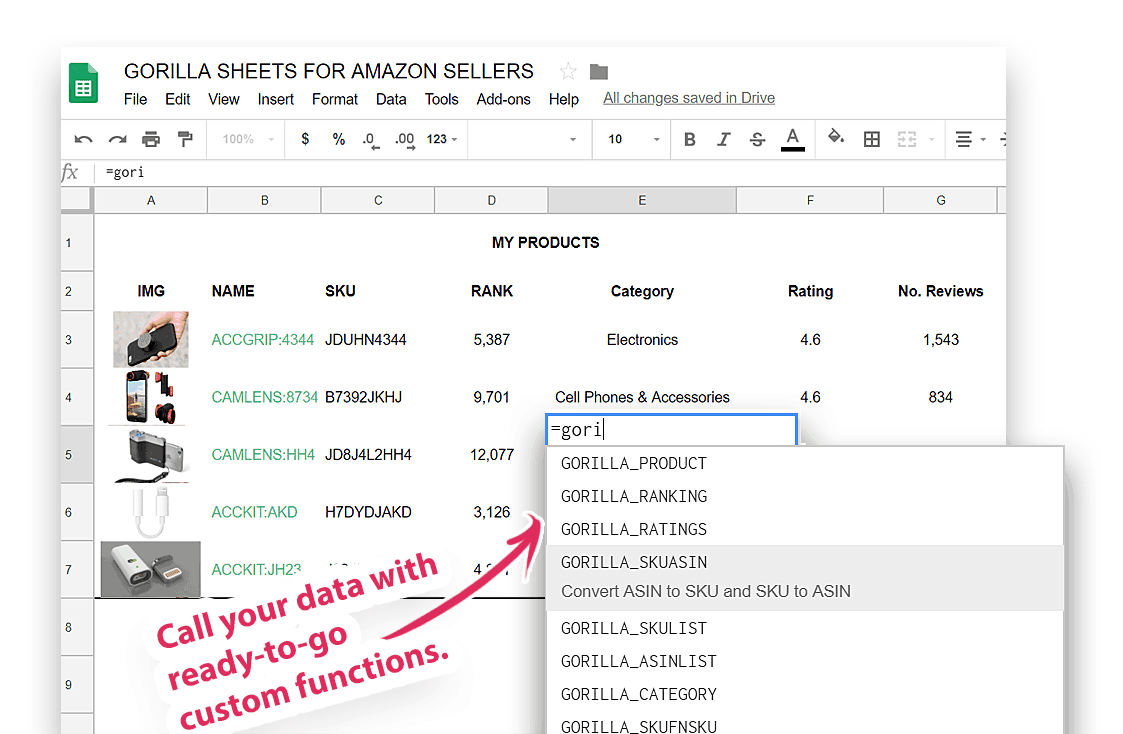
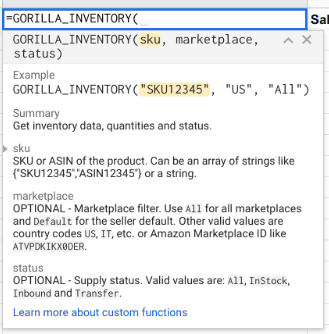
- Pull inventory data with a formula as easy as =GORILLA_INVENTORY("MYSKU")
As you type in =GORILLA_INVENTORY and you will see the popup menu appear.
Follow the syntax and example and you can pull the required data you need.
Being able to access your data without any code or help from programmers or other people means that you can create your own flexible and internal inventory application. Why not look like a genius in front of your peers?
We also support tracking daily inventory levels. You can filter by total availability, instock, inbound or transfer.
This way, you can see when an item went out of stock for better inventory forecasting and you can focus on making better decisions with your inventory.
When you combine the inventory data along with flexible custom sales data, you can create a powerful internal management system to solve your warehouse tracking issues.
Click the button to start creating your own Amazon inventory management system today with our add-on.
Download the Amazon inventory management spreadsheet template
Click the button below to make a copy of the spreadsheet to your Google account.
If you use excel, you can save it to your account first, and then download it as an XLSX file by going to menu > file > Download > Microsoft Excel (.xlsx)

Ways to improve your Amazon tracker and process
Maintain around 60 days of supply
Do your best to keep around 60 days’ worth of inventory on hand at all times to cover your expected sales velocity and volume. This will help you avoid overstocking as well as going out of stock. You can forecast your sales volume by reviewing Amazon’s inventory reports as well as by monitoring your sell-through rate.
Your sell-through rate for FBA is measured by how well you are balancing your inventory levels and sales. It’s calculated by dividing the total units sold and shipped to customers over the past 90 days by the average number of FBA inventory units during that same time period. You can see your sell-through rate for each product you sell under the “Inventory Age” section in the Inventory Dashboard in Seller Central.
A sell-through rate of over 7 is considered excellent. This means you are selling 7 times more units than you are storing on average. If your sell-through rate is less than 1, this means you held more inventory than you sold in the past 90 days. A low sell-through rate means you are overstocking units and need to figure out ways to reduce your inventory in FBA.
Reduce excess inventory
If you overestimated the sales volume of one of your products, don’t worry! It happens to everyone 一 even big brands.
There are a few different ways to deal with excess inventory, including:
- Run promotions: This can include using coupons codes, buy-one-get-one deals, or running steep discounts. Lowering your price is usually a great way to accelerate sales for slow-moving inventory. Even if you’re taking a slight loss in sale price, it could amount to less than what you would owe in long-term storage fees if the units continue to sit in storage.
- Raise your keyword bids: If you are running ads for your products (which you should be doing anyway) a good way to get in front of more customers to get rid of the product is to raise the bids on keywords you are targeting. This strategy, paired with lowering your price, is a sure-fire way to move stale inventory.
- Create a removal order: If you have another place to store inventory other than Amazon, create a removal order in Seller Central and have the inventory sent to you before getting hit with large storage fees. Amazon at times will run promotions where they will remove the inventory for free.
- Liquidate the inventory: Liquidation is usually a last resort but if all other efforts fail, you can try to sell all of your remaining inventory in bulk at a large discount. This will allow you to gain back some capital that can be reinvested into a better-selling product.
- Donate the inventory: You also have the option of donating your products to charity organizations or non-profit such as Goodwill. You can often write off the donated inventory on your taxes to make up for the losses.
Plan for the unexpected
Not everything runs smoothly all the time. You may have delays with your supplier, shipping delays, customs delays, FBA warehouse delays, and other issues. The COVID pandemic was a perfect example of this: disrupted manufacturing and supply chains resulted in consumers experiencing difficulty finding products online beginning in March 2020.
If you can, order backup units just in case something happens along your supply chain. This can include storing extra units in your own warehouse or even using a third-party storage/fulfillment center. In the event of a delay, you can maintain stock in FBA without worry, or even fulfill orders using FBM. This is only recommended if you can accurately predict the demand for your product and have the ability to order and store additional units. Do not order extra if you are short on capital or storage space.
Use inventory management software
Having a reliable inventory management system in your arsenal will put you way ahead of any competitors who aren’t using one. Inventory management software such as Gorilla ROI’s Inventory Manager will help you effectively manage your inventory levels and mitigate the risks we talked about above.
Inventory Manager is an advanced demand forecasting tool designed to accurately calculate your inventory needs for your Amazon FBA business. The tool will predict future sales based on demand that will help you determine how much inventory to order to avoid stockouts or overstocking.
FAQs
How do I avoid Amazon stockouts?
I normally wouldn’t recommend that you purposefully slow your own sales, but this is a smart way to prevent yourself from going out of stock while you replenish inventory — all without losing your listing or rank. So keep tabs on your inventory levels, and when they’re running low consider these two strategies:
- Pause any marketing or advertising campaigns you may be running online. This way less people will be driven to your listing.
- Increase the price of a product to decrease its demand.
- Change your listing setting to “on vacation” (though keep in mind this will only turn self-fulfilled listings inactive; if you are an FBA seller, the listings will remain active).
How do I check my Amazon inventory?
To view your inventory, go to the Inventory menu and select Manage Inventory. To help you distinguish your inventory at a glance, additional information appears in the Product Name field for some categories. Click any of the highlighted column headers to sort the product list by that column.
Where is the inventory tab on Amazon?
The inventory tab is located at the top of the Seller Central page
How does Amazon keep track of stock?
When sellers choose to use FBA, they automatically gain access to Amazon's machine learning-based inventory management system. This system uses inputs like the cost of goods sold, shipment time, and Amazon data to forecast customer demand and set optimum inventory levels. Otherwise, sellers simply would have to create their own AI automation system. In this case, they would need to do proper image annotation when it comes to visual data so that their model can comprehend and learn it for automating tasks.
How do I manage my Amazon FBA inventory?
You can manage your inventory by using the inventory management tools on the Manage Inventory page for routine inventory management tasks, including specific FBA tasks such as creating a shipping plan or submitting Multi-Channel Fulfillment orders. You can also set filters and preferences to create customized displays of your FBA inventory.